AstraField Request access

Technology

Four views of one field

Each layer sees its own thing. Together they add up to a cause: nitrogen, moisture, biomass, gaps or stress, not just “weaker here”. And we say honestly where each layer's limit is.

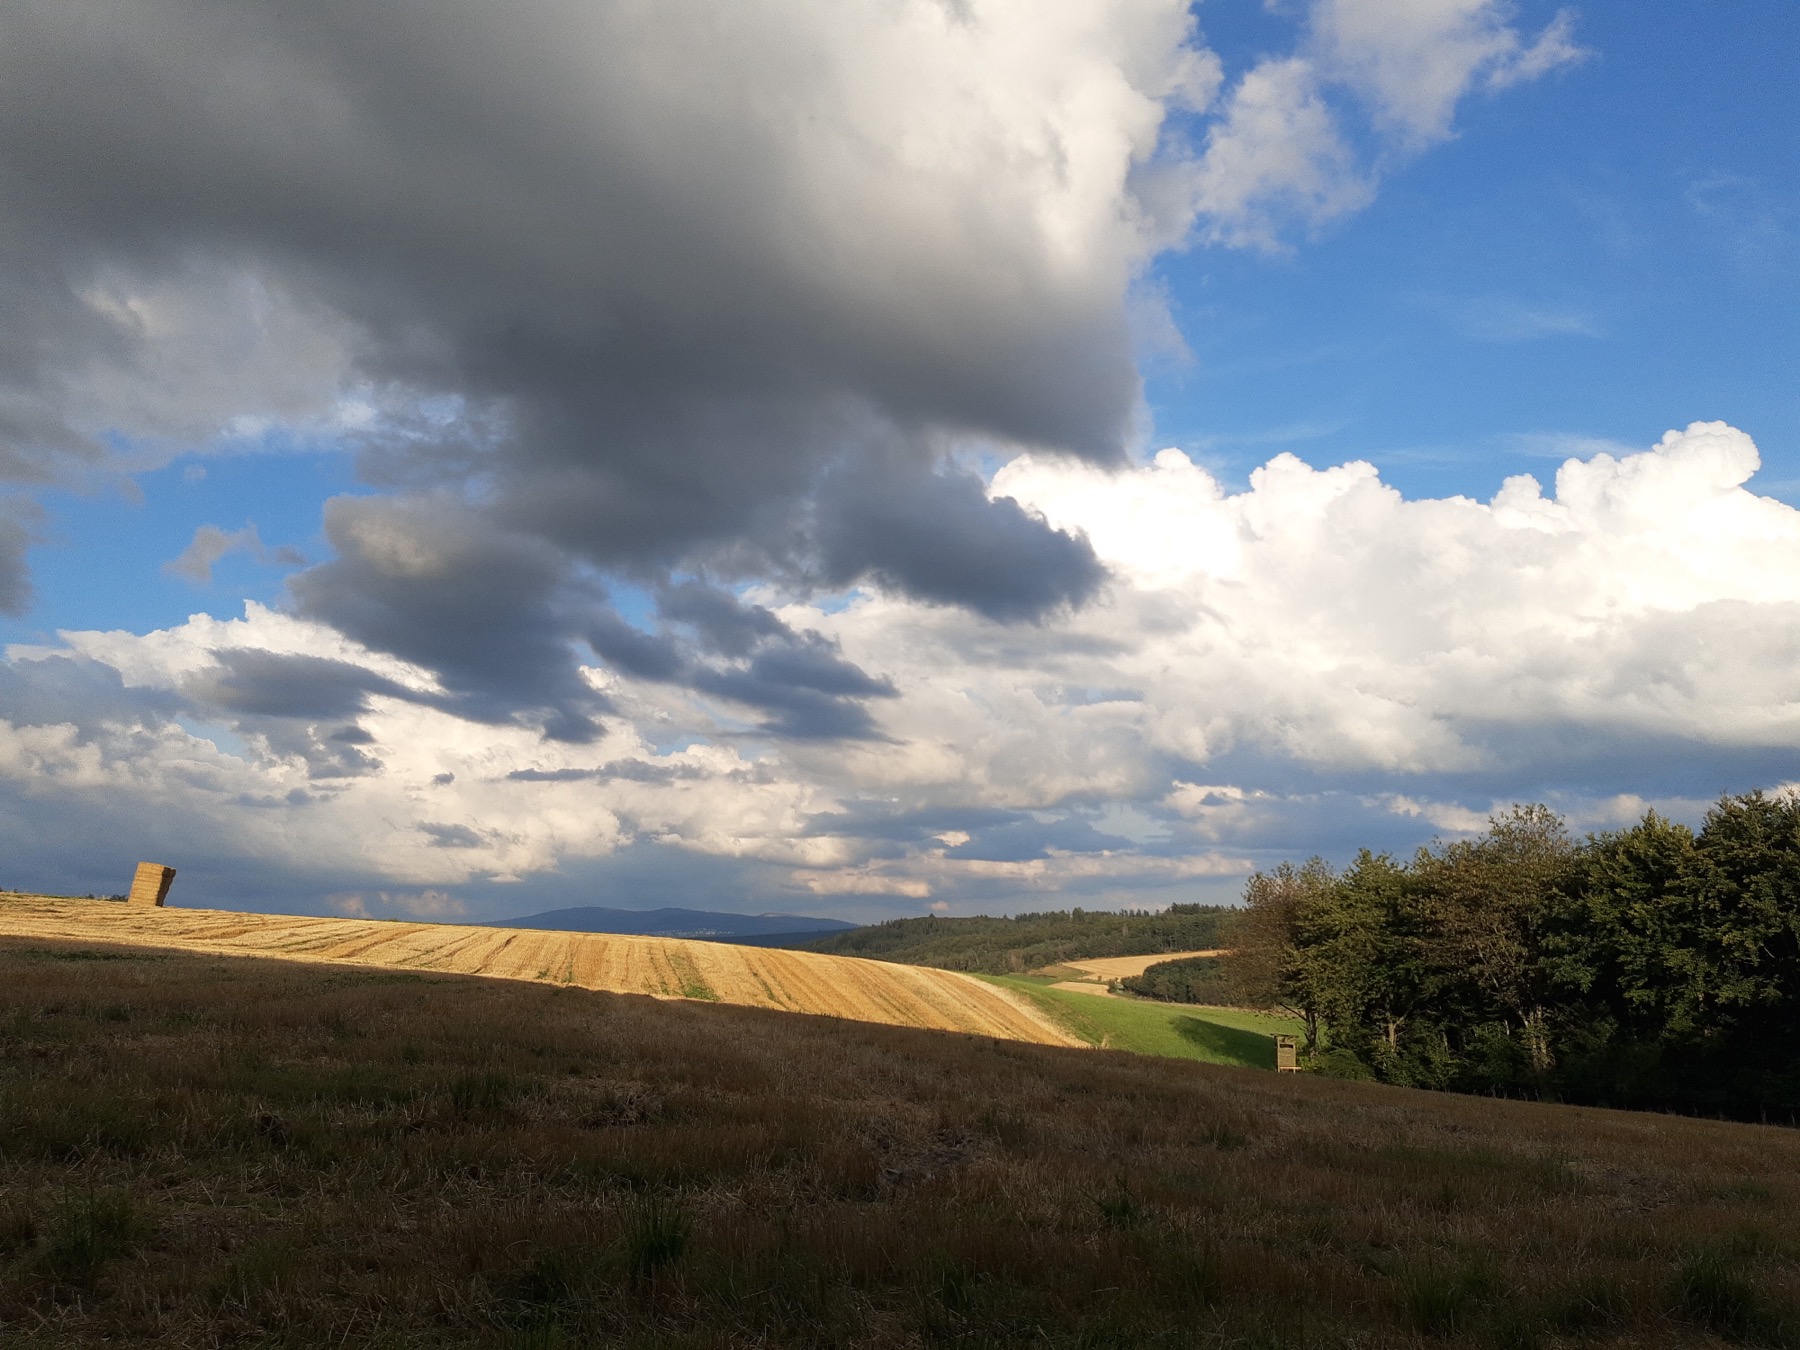
A cloud front hides the field from optical sensors, while radar sees through any weather
01

Radar

All-weather, through clouds and at night.

Radar doesn't depend on light or cloud: it sees canopy structure and soil moisture where optical is silent for weeks. In the south, where a cloud front hides the field at the most important moment of the season, it's often the only way not to lose observation.

The method's limit: Radar senses structure and moisture, but not a plant's “colour”, so you can't read biochemistry from it. We use it as an all-weather backbone and to fill optical gaps.
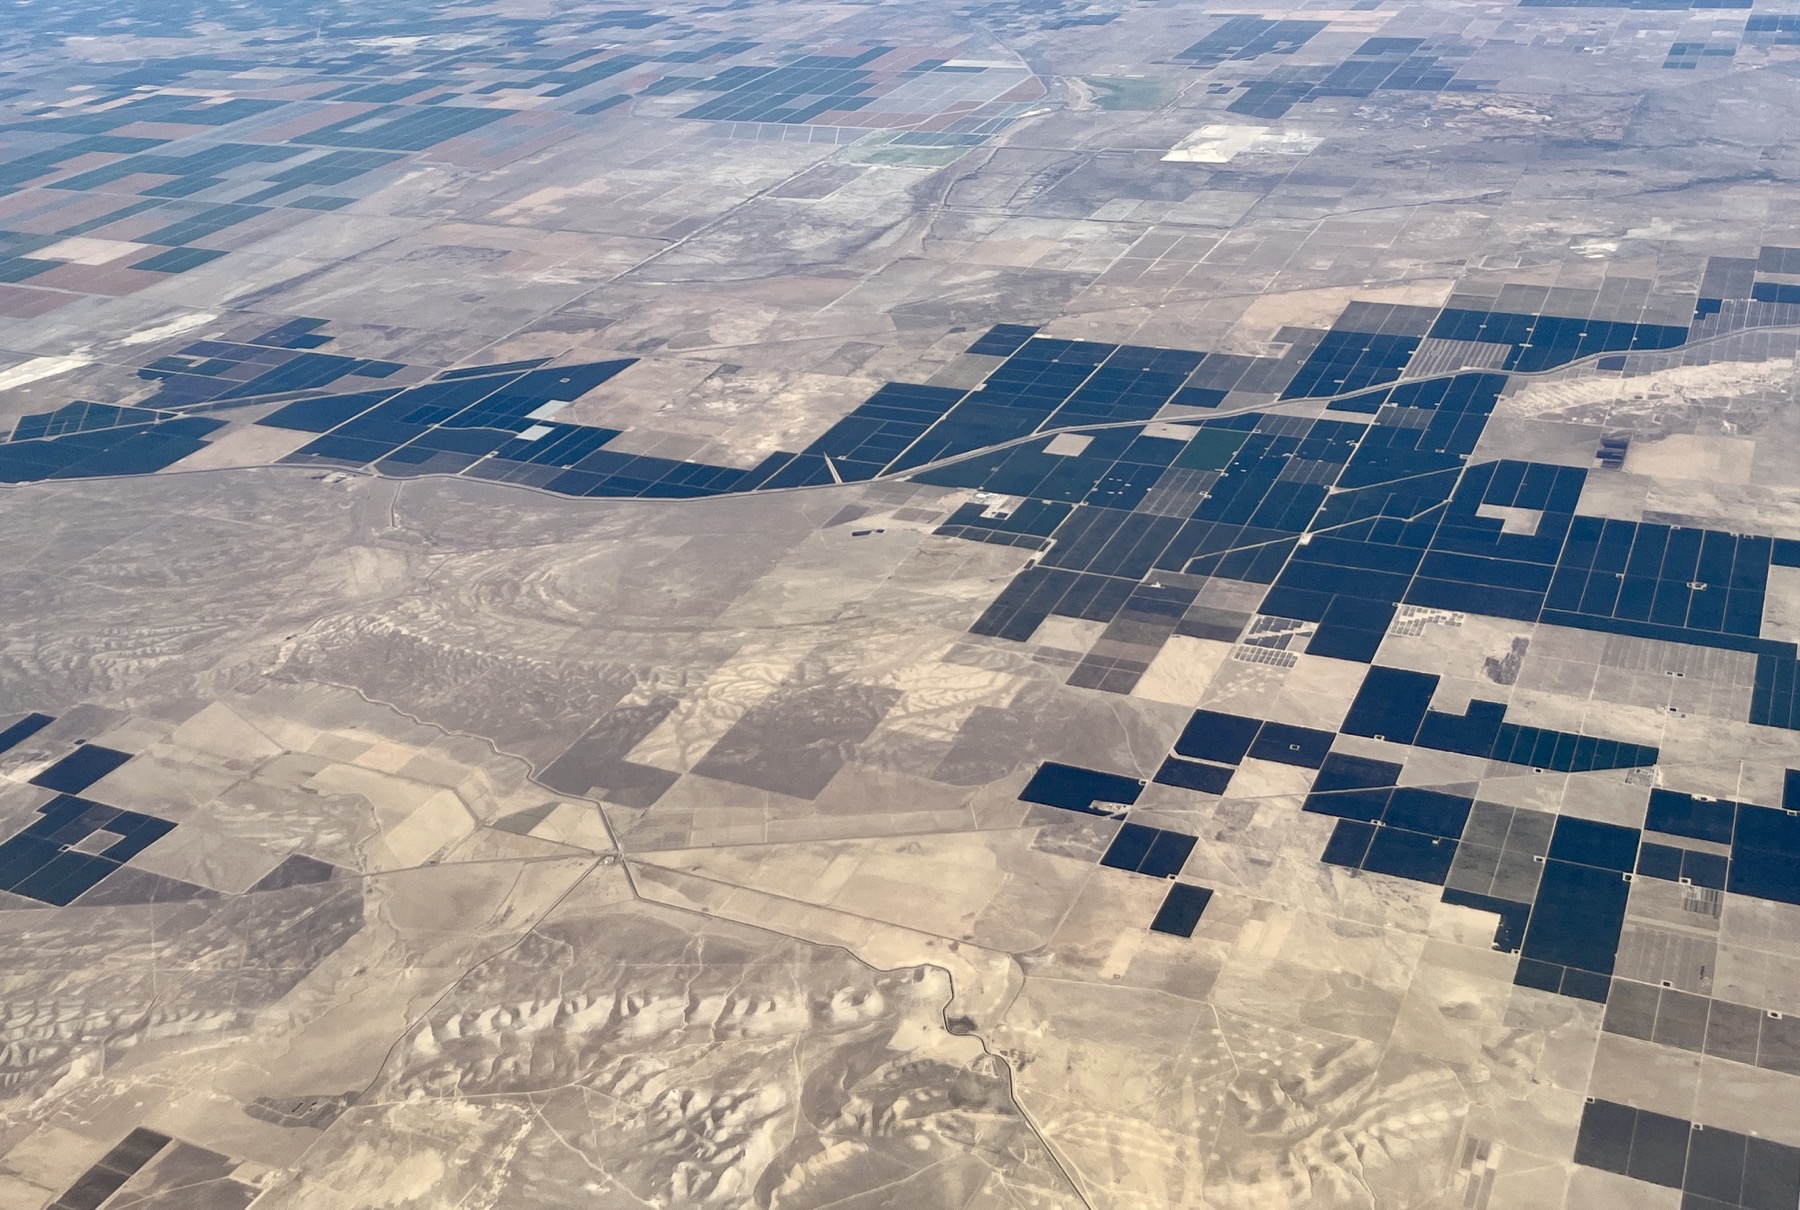
Regular coverage of the whole area: from emergence to harvest, across all fields
02

Multispectral

The base of regular monitoring from emergence to harvest.

Several broad channels, including the “red edge”, a narrow spectral zone that reveals biomass, nitrogen status and leaf moisture. This is the workhorse of monitoring: regular, across the whole area, over the season's dynamics.

The method's limit: Resolution is tens of metres: you see zones, not individual plants. Cloud-free images come every few days, and cloud thins them out.

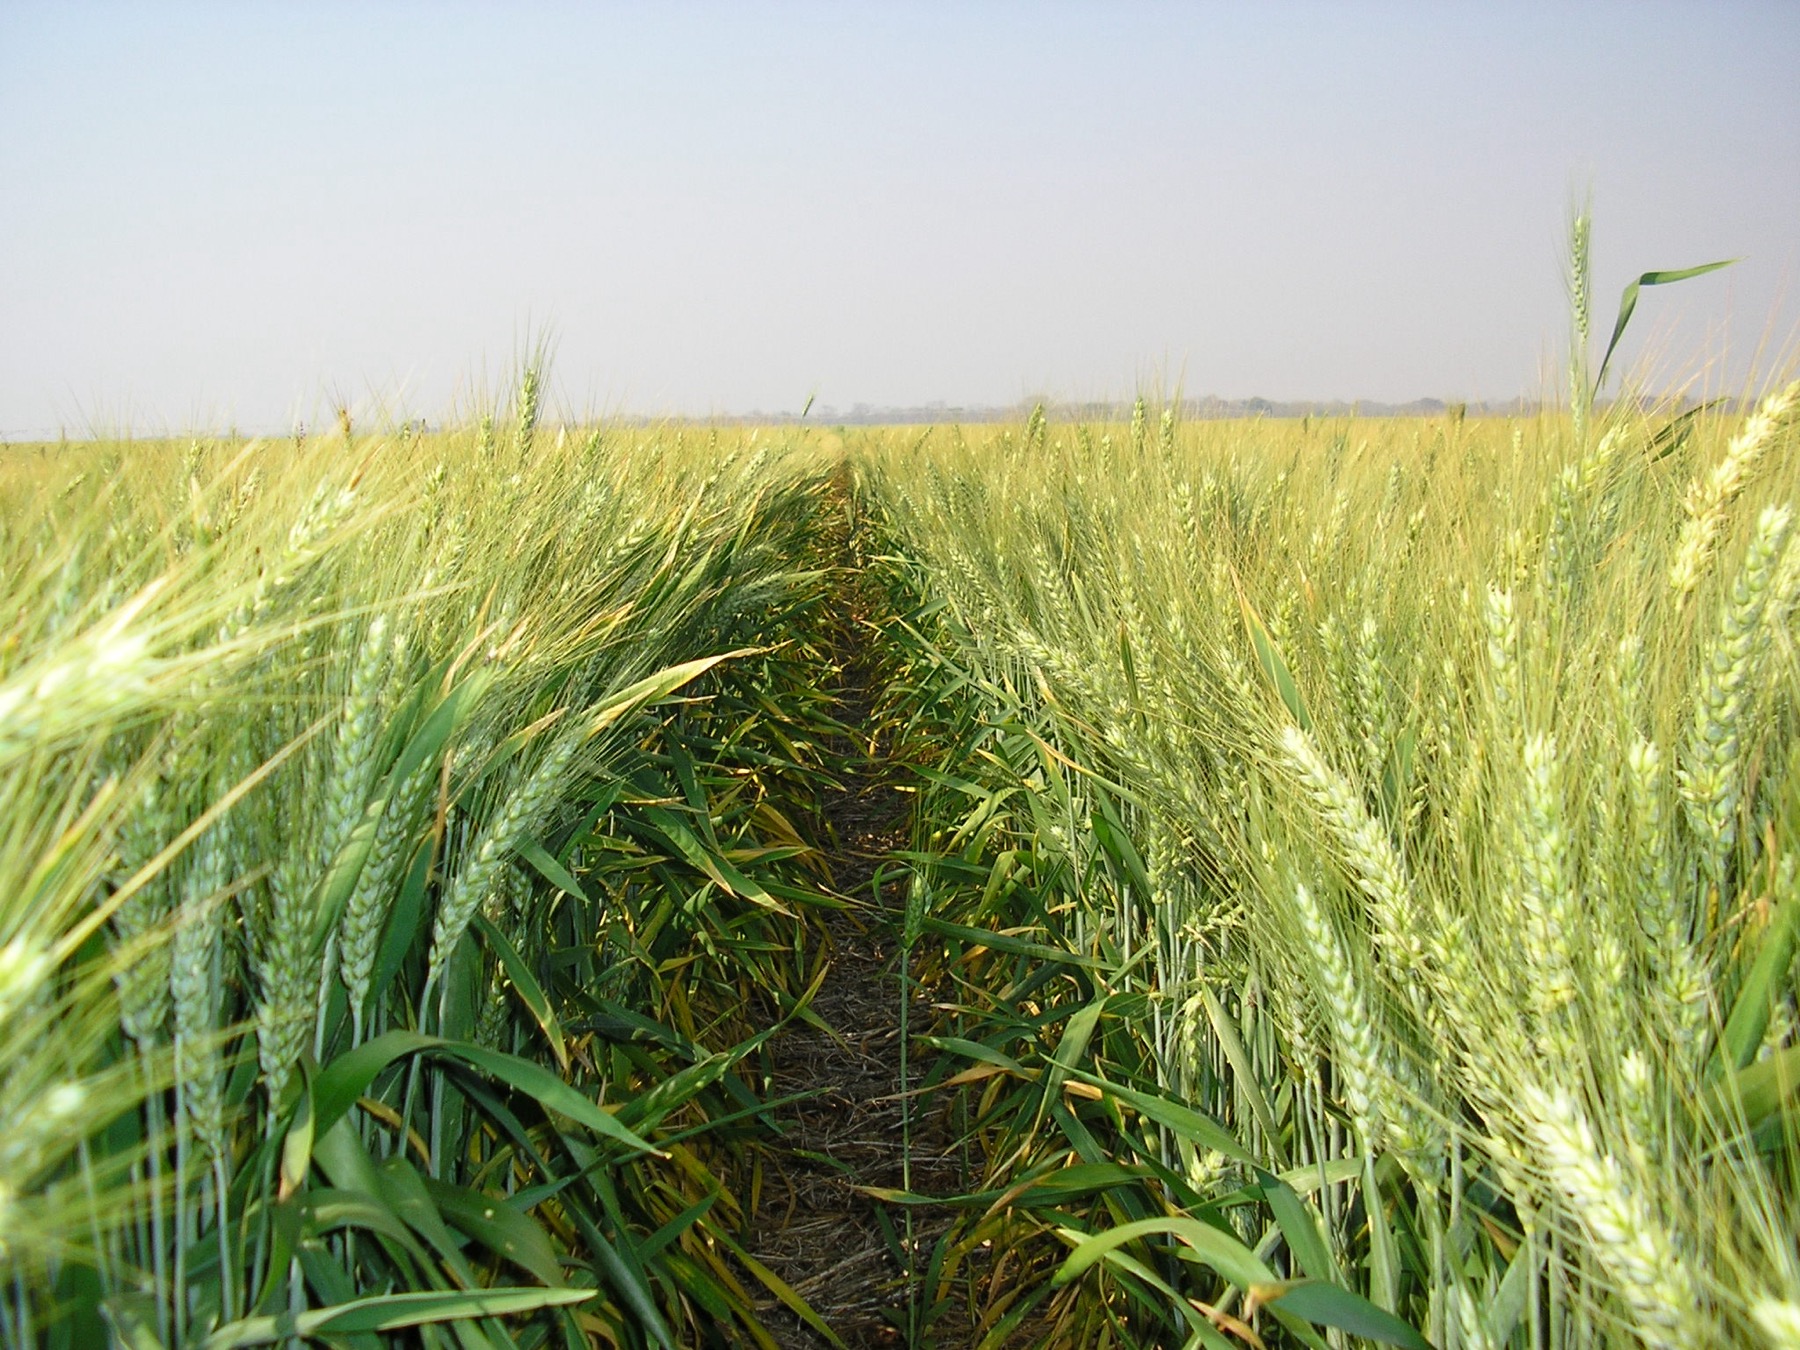
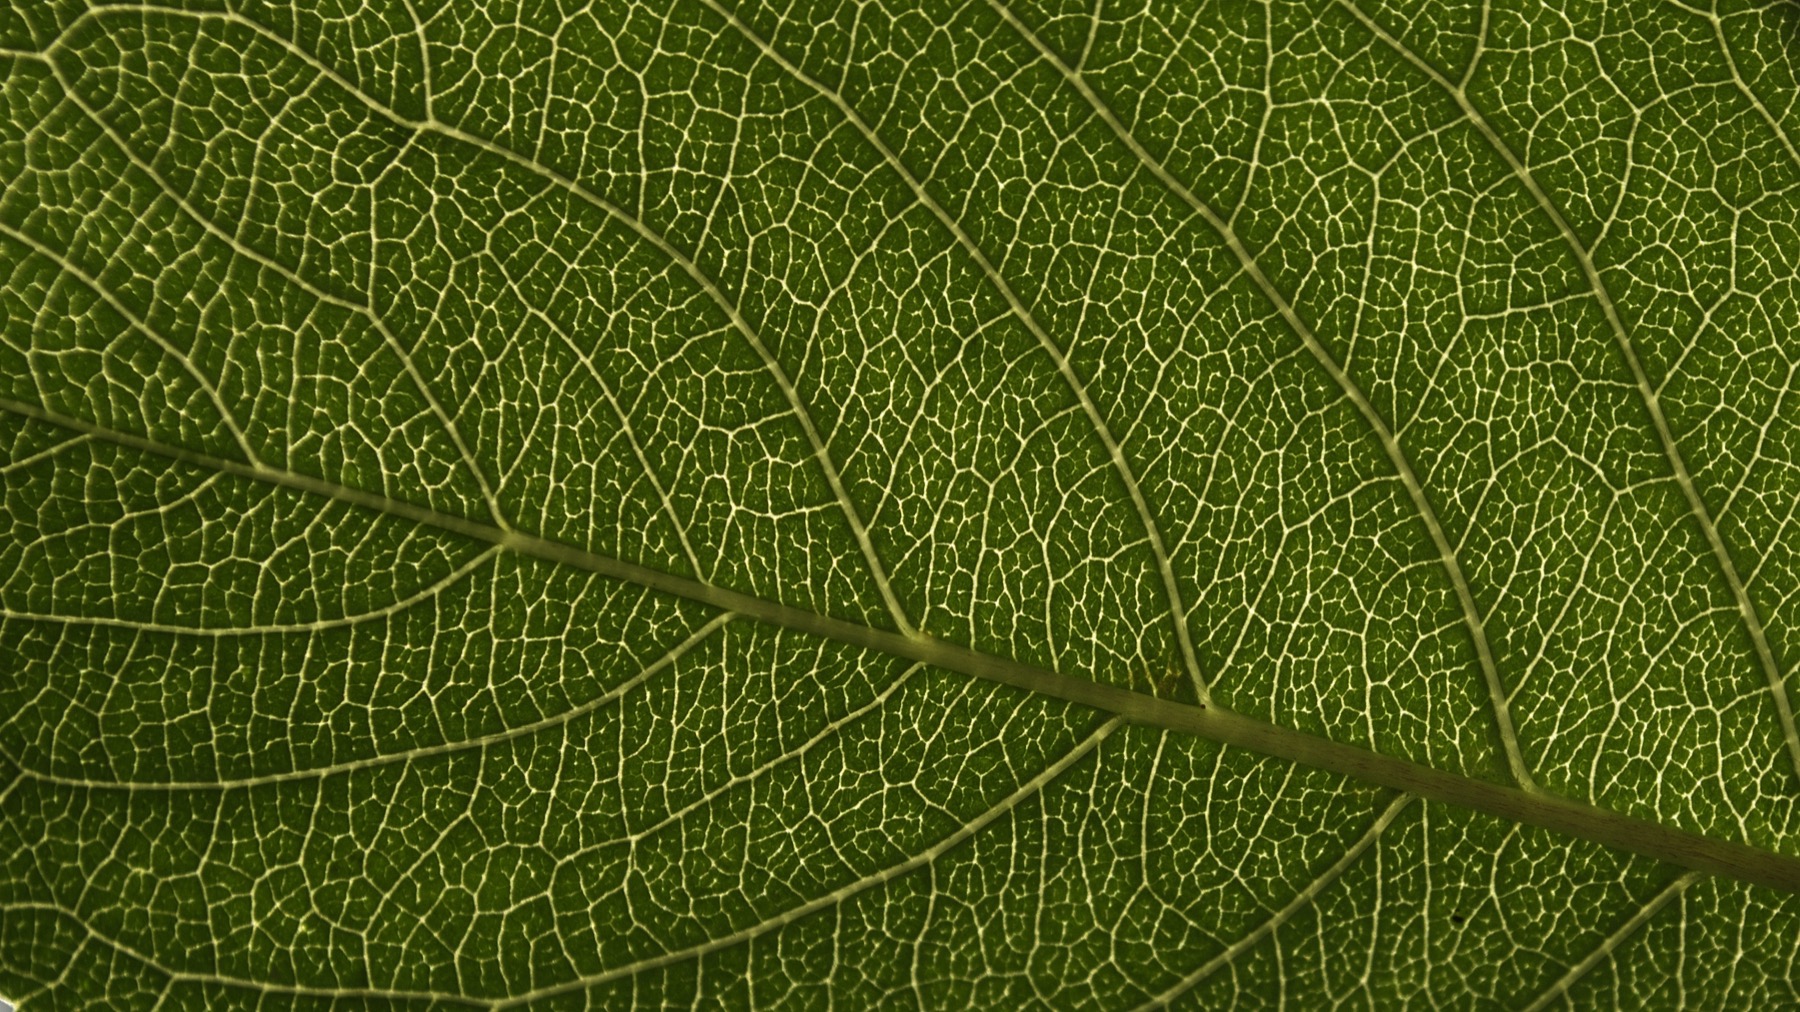
Leaf chemistry: chlorophyll, nitrogen and moisture read from the plant's spectrum
03

Hyperspectral

Hundreds of narrow bands, a chemical portrait of the plant.

Where multispectral sees a few colours, hyperspectral sees hundreds. This lets us assess chlorophyll, pigments and water in the leaf, the crop's biochemistry, which otherwise would have to be measured in the field and the lab.

The method's limit: Imaging is rarer and coarser in resolution than multispectral; it's a tool for in-depth diagnosis, not daily monitoring.

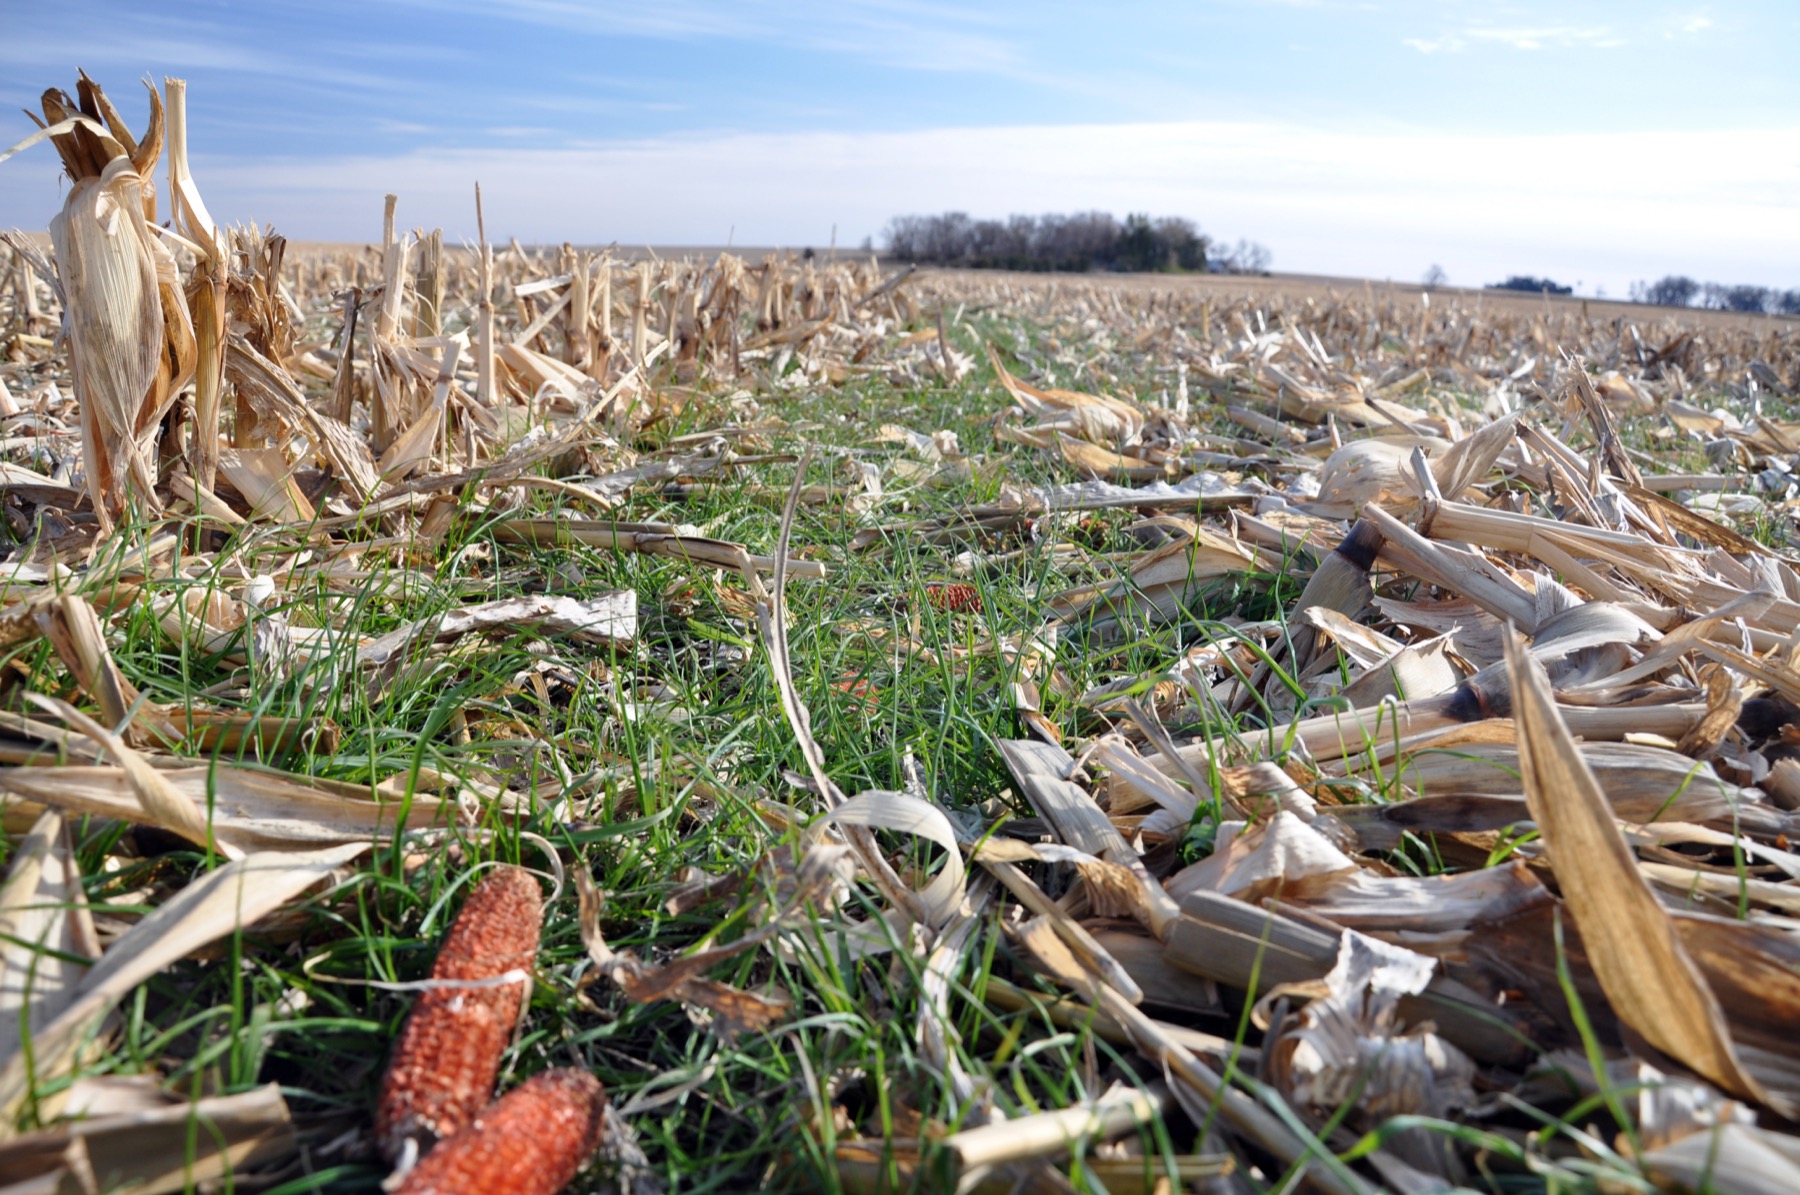
Detailed aerial imagery: rows and the cover crop between them are visible
04

High-resolution imageryon request

Sovereign high-resolution imagery for verification.

When we need to confirm what the algorithm saw (field boundaries, the fact of sowing, emergence quality), we bring in domestic high-resolution imagery. This is an evidence base for the agronomist, the insurer or the bank.

The method's limit: This isn't a constant layer but commissioned imagery: pricier and slower than regular monitoring. It's used selectively, where detailed verification is needed.

Layers compared

Why one index doesn't cover the season

No single layer answers every question. Radar keeps watch through clouds, optical reads biomass and nitrogen, hyperspectral goes deep into leaf chemistry. The strength is that they complement each other.

LayerWhat it seesCadenceThrough cloudsLimit
Optical (multispectral) Biomass, nitrogen by the red edge, leaf moisture Every few days in clear weather No Cloud thins the imagery
Radar Canopy structure and soil moisture Every 3-6 days, all-weather Yes Doesn't read plant biochemistry
Hyperspectral Chlorophyll, pigments and water: leaf chemistry Episodic Partly Rarer and coarser in resolution
High-resolution imagery Rows, field boundaries, the fact of sowing On request Depends on the pass Pricier and slower, selective

Diagnostics

A cause, not an index

The layers converge on a diagnosis. One weak zone breaks down into clear causes: each with its own hectares, confidence level and recommended action. So for us a low NDVI isn't “go take a look”, it's “nitrogen here, water here, no crop at all here”.

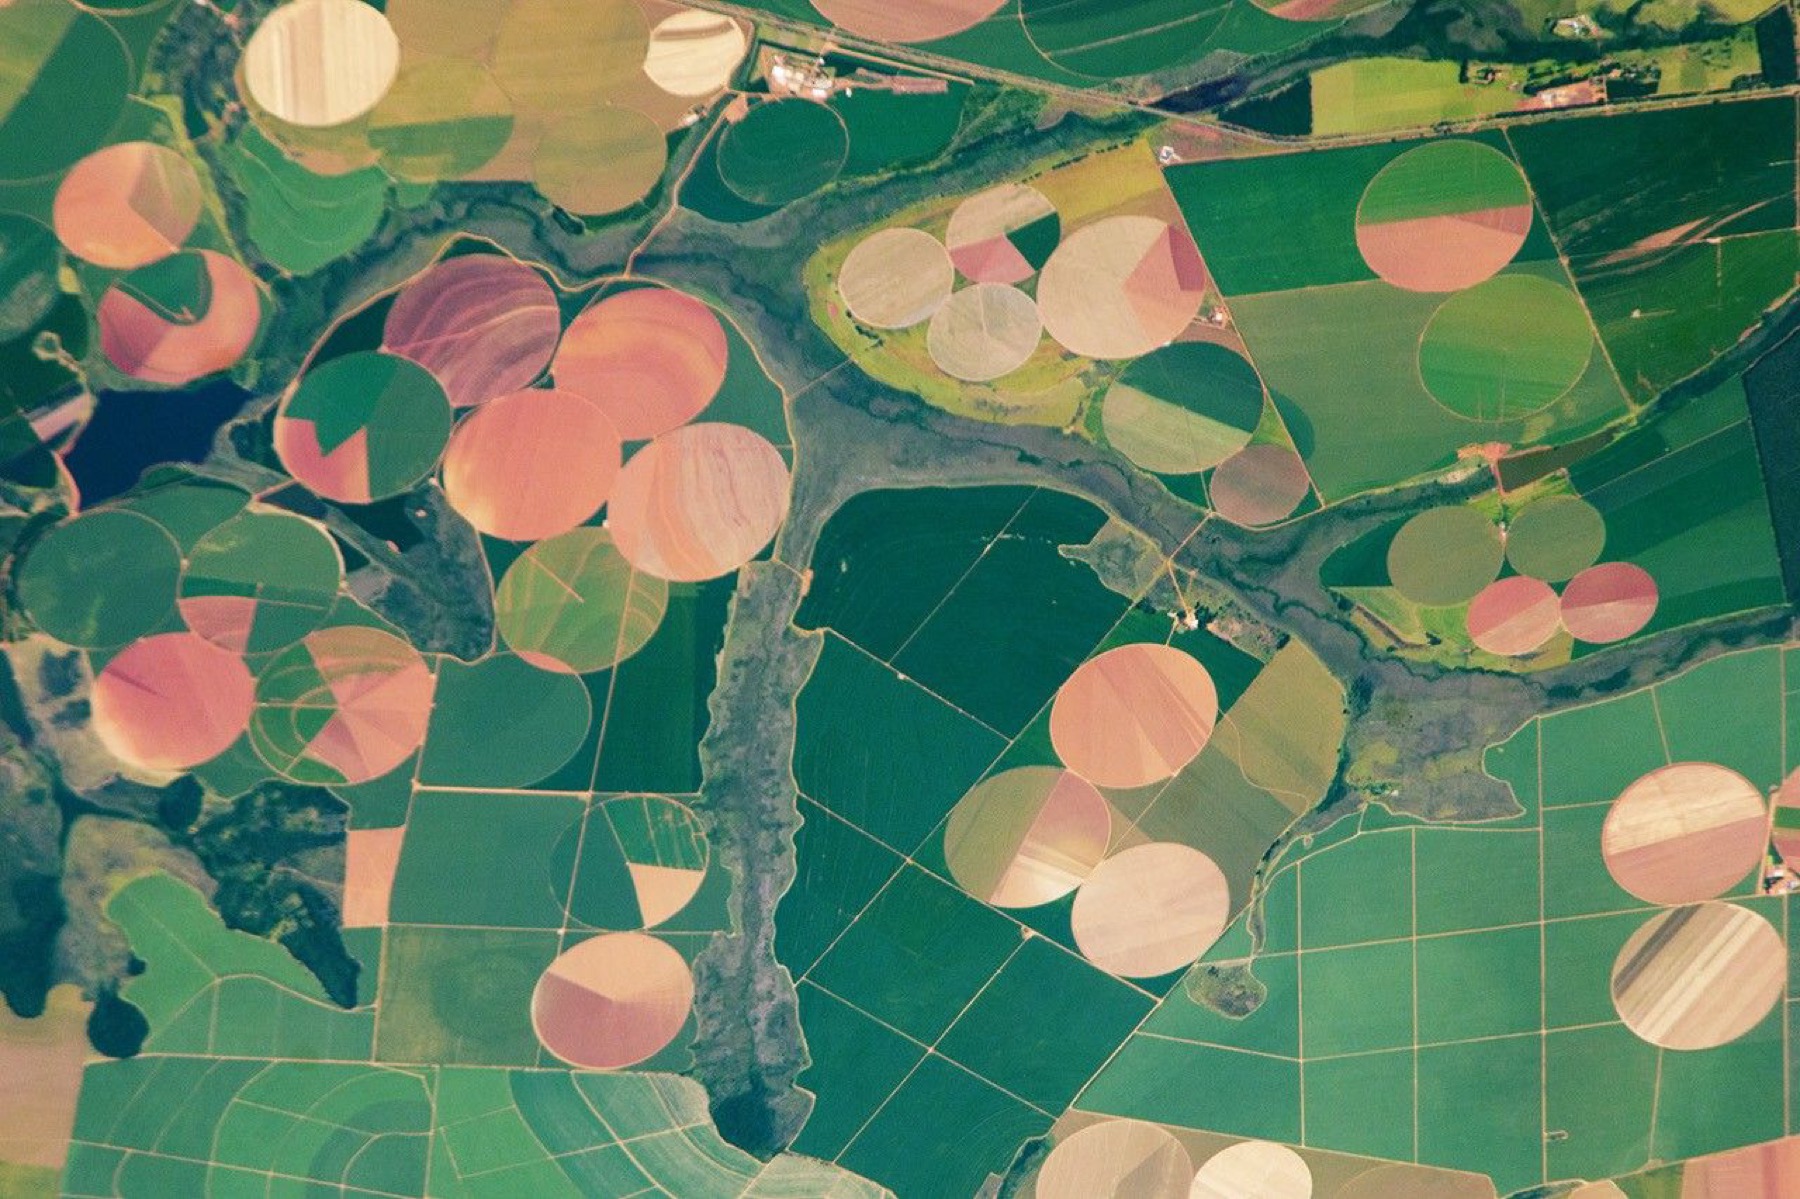
Pivot fields in various shades of green: variability of growth within and between fields
The same field is uneven: variegation always has a cause

Capabilities

Eight field scenarios

Not images, but decisions. Pick a scenario: what we show, which question of the season it closes and which action to launch.

Vegetation and biomass

How strong is the canopy and where does it sag?

What we show

A canopy development curve over the season across the whole area: when it plateaued and when it started ageing.

Action

Scout the lagging zones instead of a full drive-around.

All field actions →  ·  Science & practice →

The workspace

Field ranking: where to drive first

Many signals converge into one list. Fields are sorted by priority, each with a cause and a ready action. This is what the work queue looks like instead of a dozen maps.

demonstration data
FieldCrophaPriorityCauseAction
Field B-7 Winter wheat 142 86 Nitrogen Task map
Field D-4 Soybeans 88 79 Moisture Irrigate zone
Field A-2 Sunflower 96 63 Biomass Scout, 4 points
Field M-5 Maize 210 44 Area audit Exclude the miss
Field K-1 Barley 73 21 Normal Monitor

Honest about the limits

Satellites remove blind spots but replace neither soil analysis nor the experience of the person who works this land. They show where and when to look, while the agronomist makes the diagnosis.

Cloud thins the optical; radar fills the gaps, but on dry, sparse vegetation the link between them is weaker. So we don't promise a hit in every window, we honestly show which data we rely on.

Quantitative estimates (yield, for example) come with a tolerance until there's ground calibration for a specific field. We calibrate the model on your data, we don't pass off someone else's percentages as yours.

Request access

Cause. Confirmation. Action.

One product turns a field's spectrum into a concrete step. Start with a free pilot on your own fields.