Radar
All-weather: through clouds and at night.
A hyperspectral action system
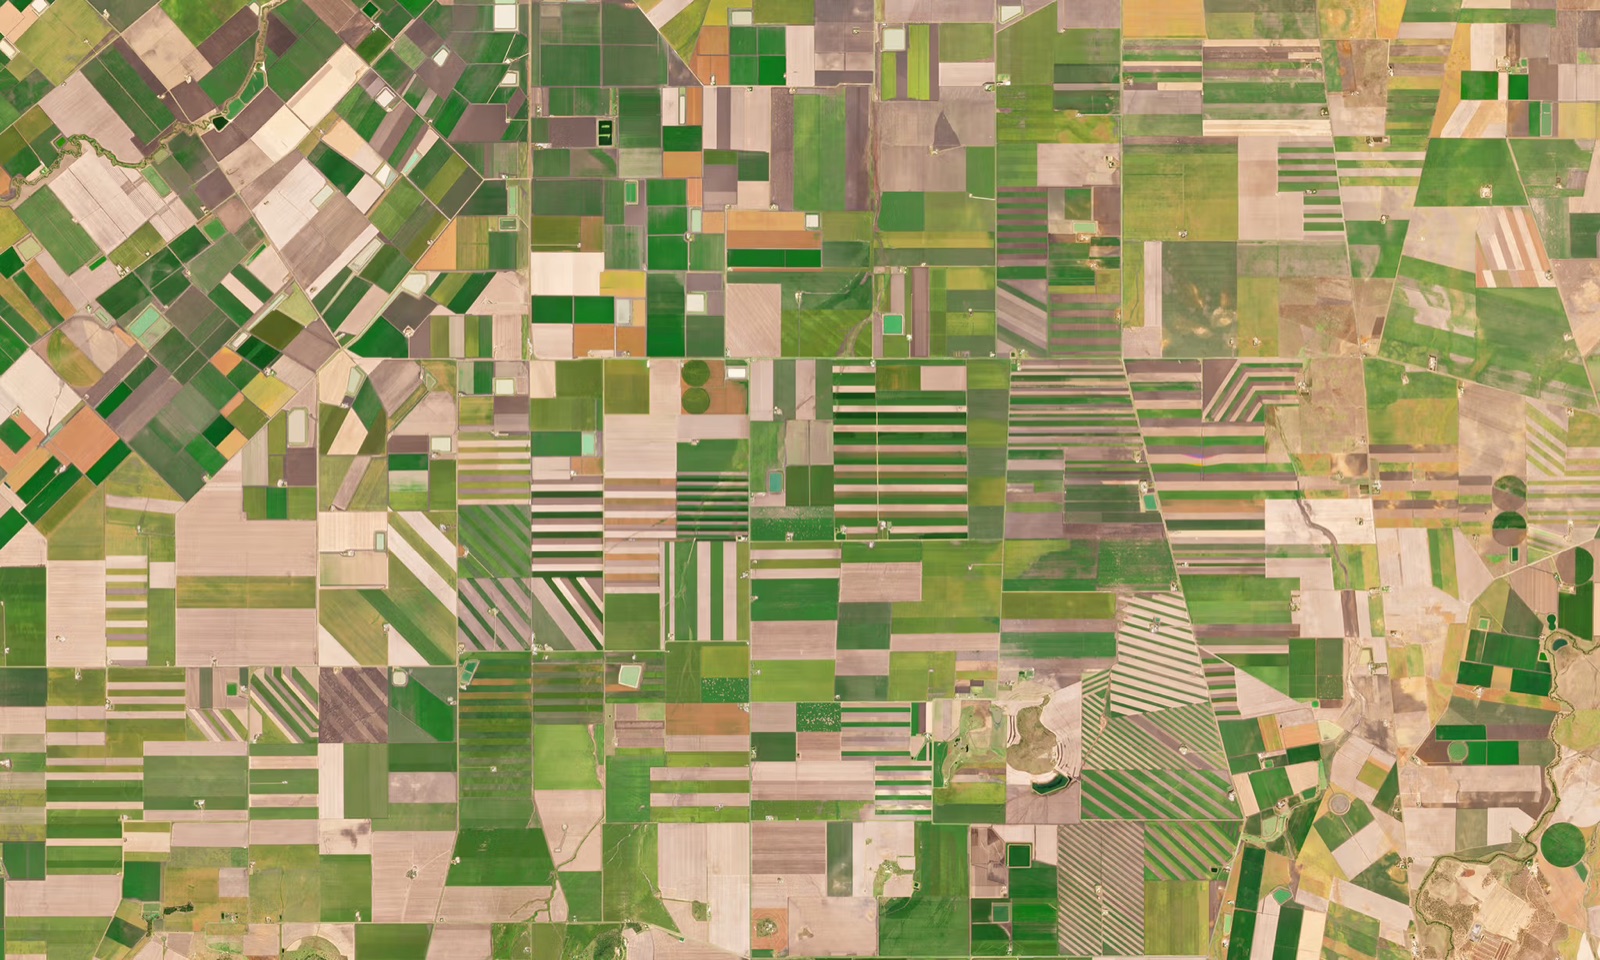
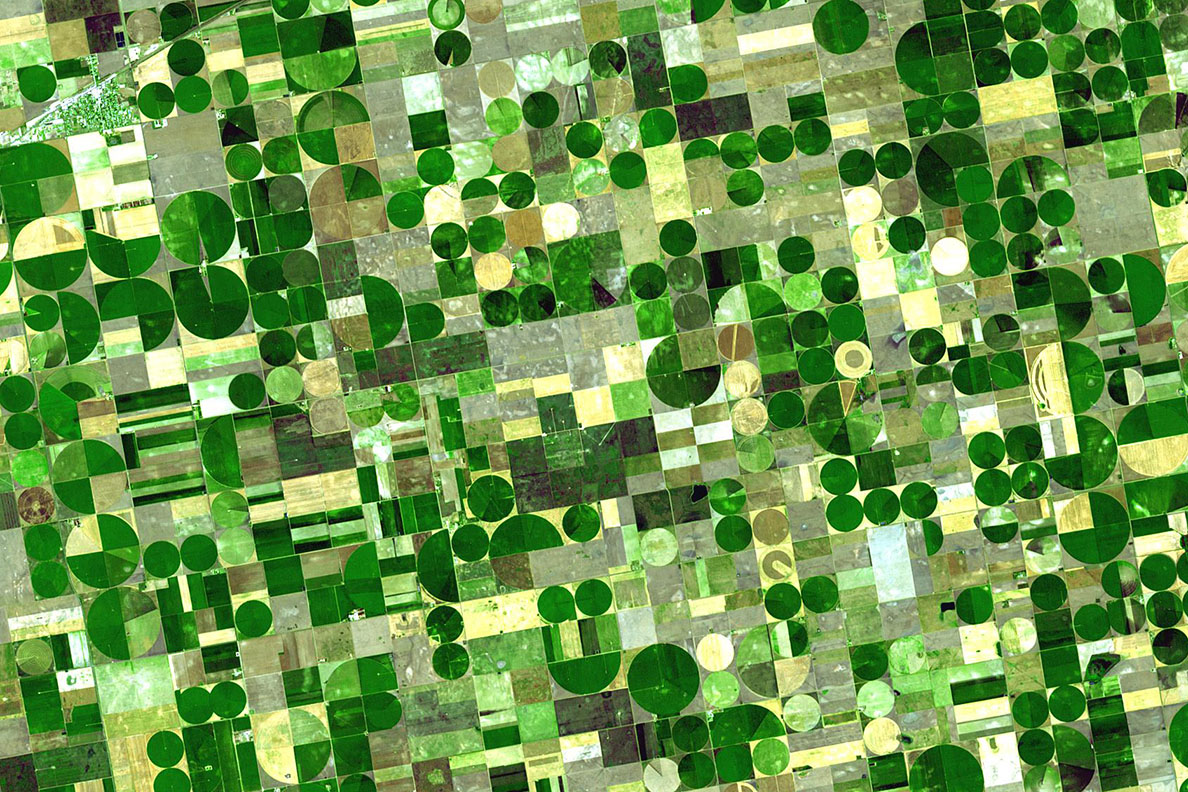
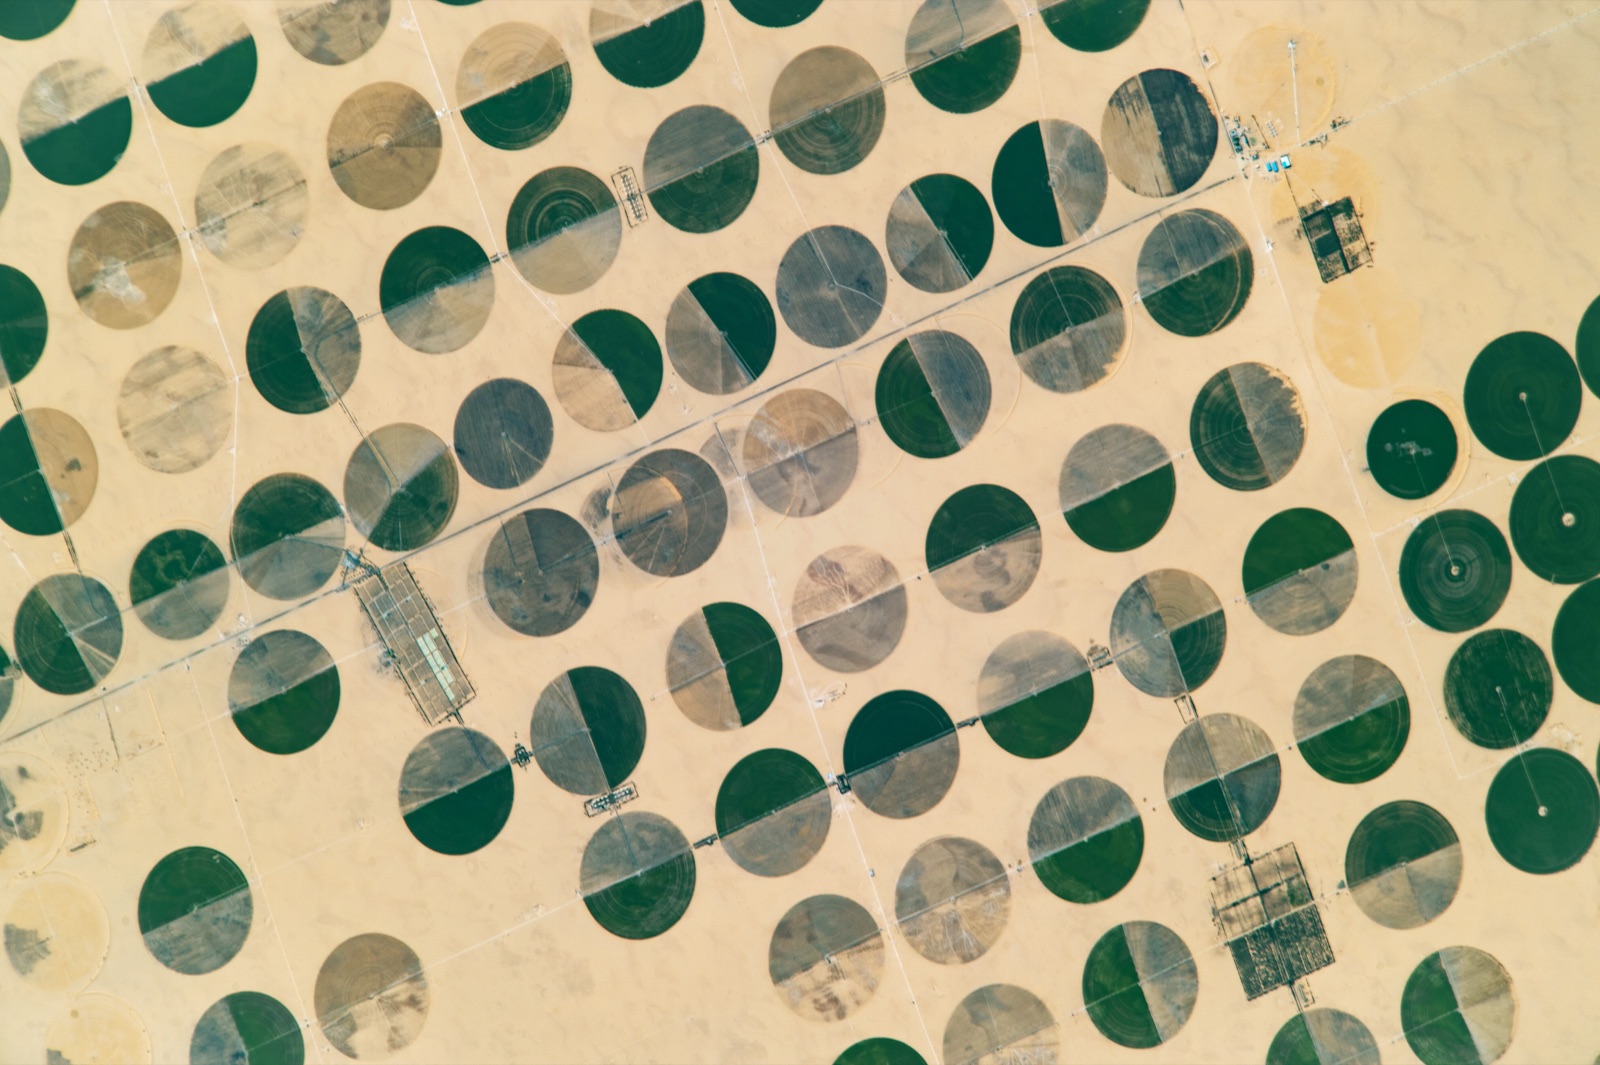
The satellite sees the whole field: where nitrogen is short, where it's drying, where nothing came up. Earlier than it becomes visible from the ground.
Why it matters
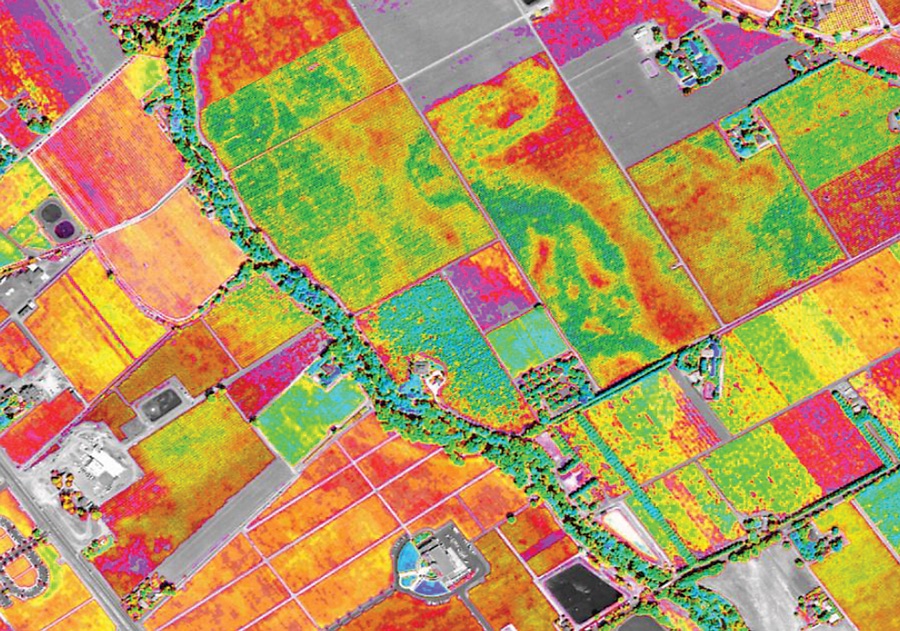
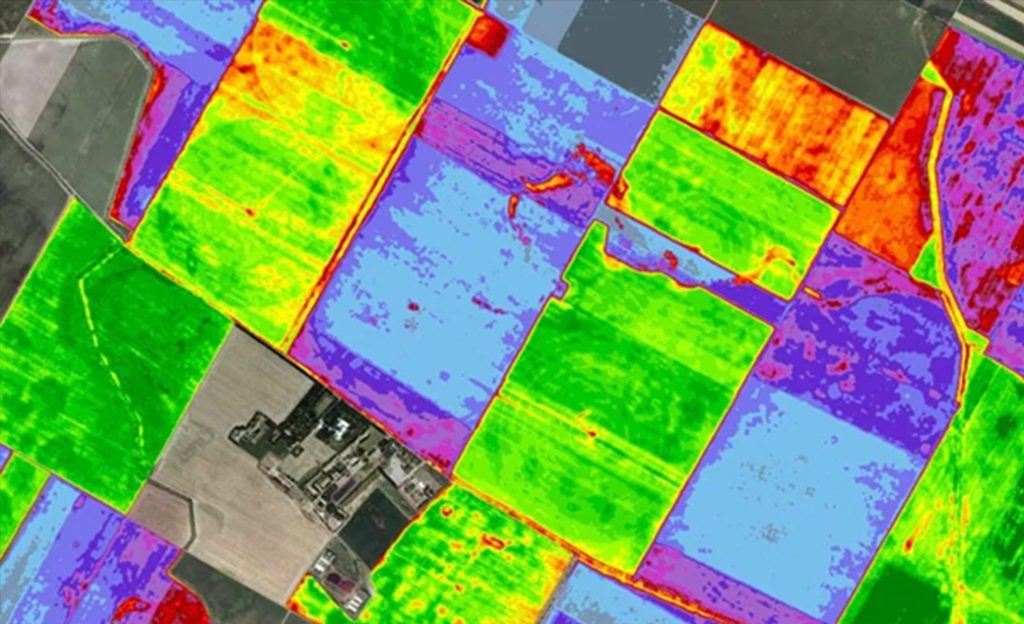
An index shows that a patch differs from its neighbour. But not what's wrong. And from there the cause decides everything: where nitrogen is needed, where water is, and where the field simply wasn't sown.
What's happening in the zone, not just “weaker here”.
We check it on the ground, by drone or by sample.
Scouting, task map, irrigation or treatment.
Diagnostics
One weak zone on the map can be anything. We break it down into clear causes: each with its own hectares, confidence and recommended action.
Technology
Each layer sees its own thing; together they give a picture no single image gives on its own.
All-weather: through clouds and at night.
Biomass, nitrogen and leaf moisture. The base of monitoring.
Hundreds of bands: chlorophyll, pigments, water.
Sovereign high-resolution imagery for verification.
Try it live
The canopy's overall vigour and density. The workhorse of monitoring from emergence to harvest.
Actions
For every cause the next move is ready. Some things your team does, some AstraField's partners take on.
AI agronomist
It knows your fields, reads the spectrum, explains the cause of an anomaly and prepares the next step. The decision stays with the agronomist: the agent proposes and shows the evidence, and a human launches the action.
AI proposes, the agronomist approves, AstraField launches and proves it.
Products
The diagnostic engine is the same. What differs is the starting point: strengthen what's already there, or start from scratch.
You already have a system
A full agronomist's workspace and cause diagnosis on top of the ERP, GIS and agronomist you already have. Plus an A/B benchmark next to your current system.
No system yet
For farms with no digital department. Upload your boundaries and get weekly priorities in Telegram, PDF and action buttons.
Science & practice
We don't say “it works perfectly”. We show the whole chain: signal, diagnosis, confirmation, action, result. With a confidence level and honest limits.
The field looked even, but the moisture-SWIR pairing and radar showed a water limit, and nitrogen didn't go there. Separately, an area audit took about 16 of 89 ha off uniform application. The order of zones by nitrogen agreed across two spectral sources at once: the red edge and hyperspectral.
Yield forecast
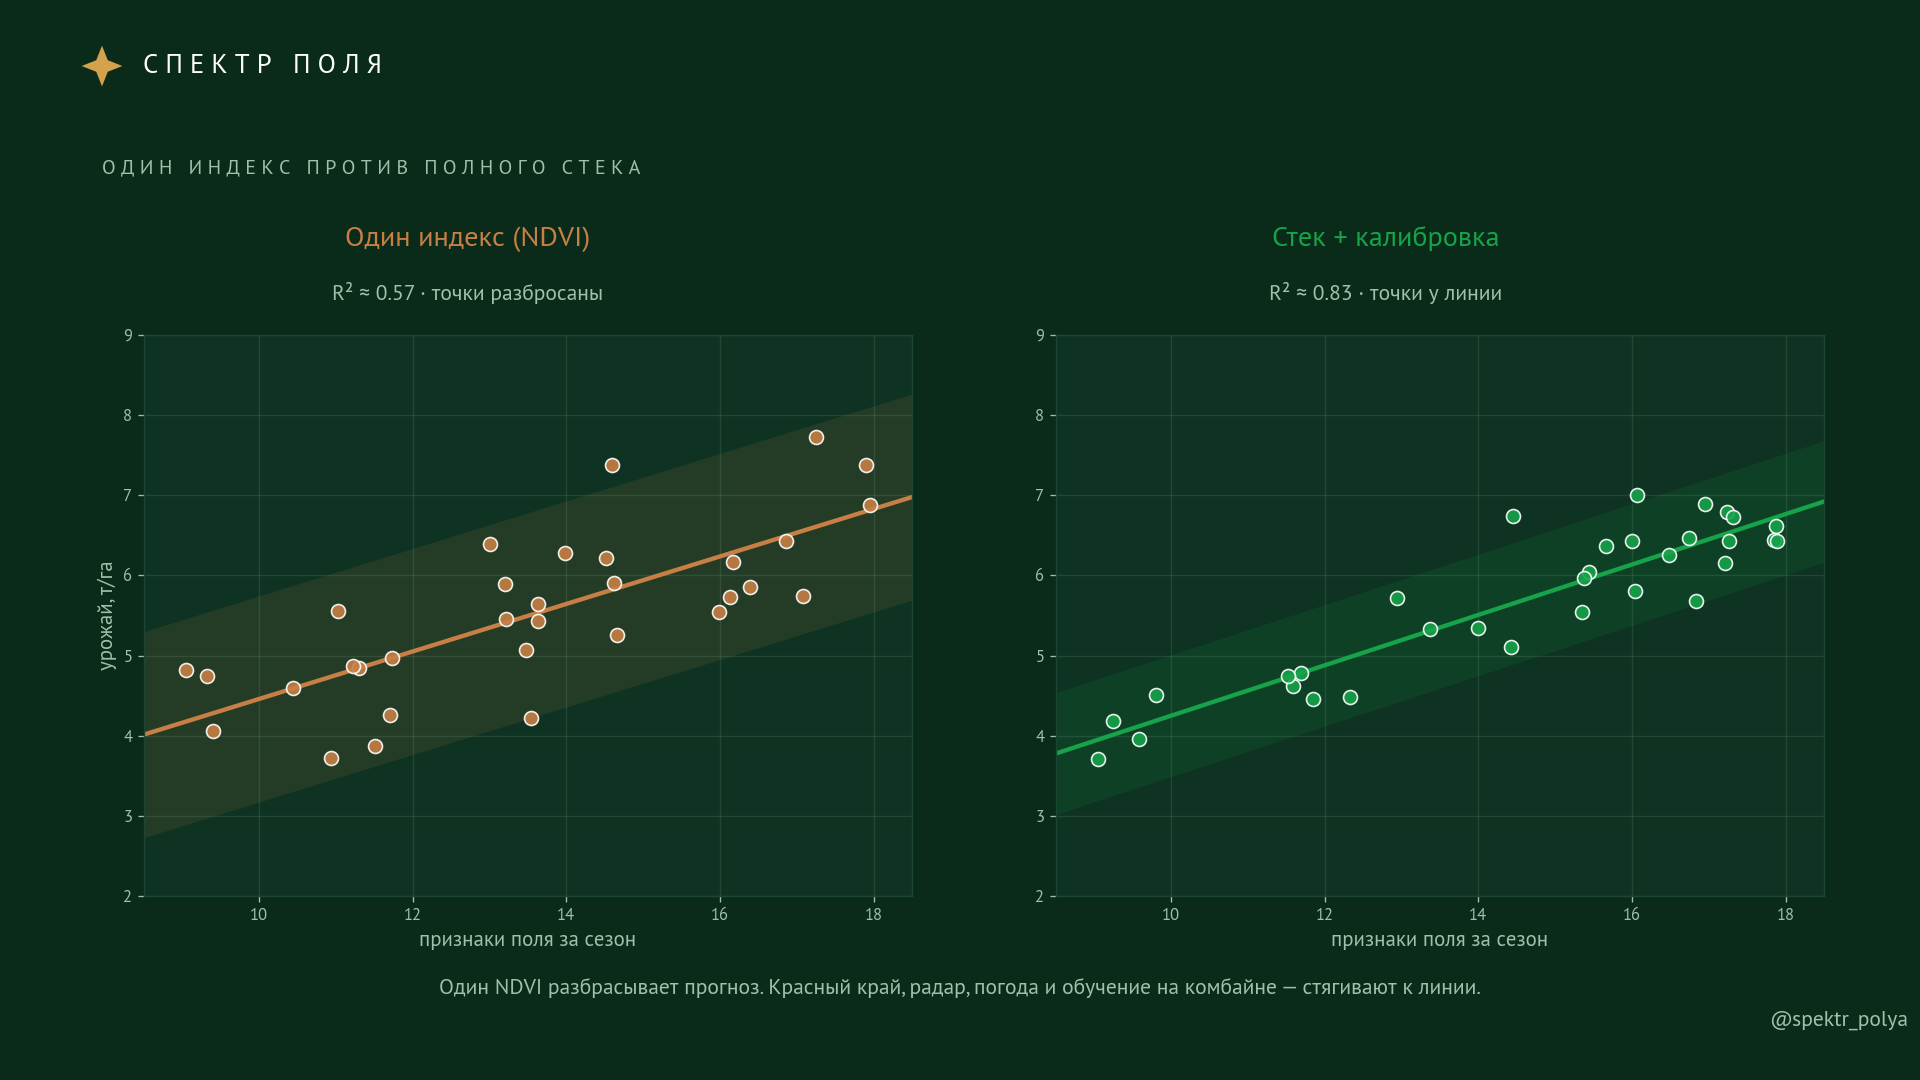
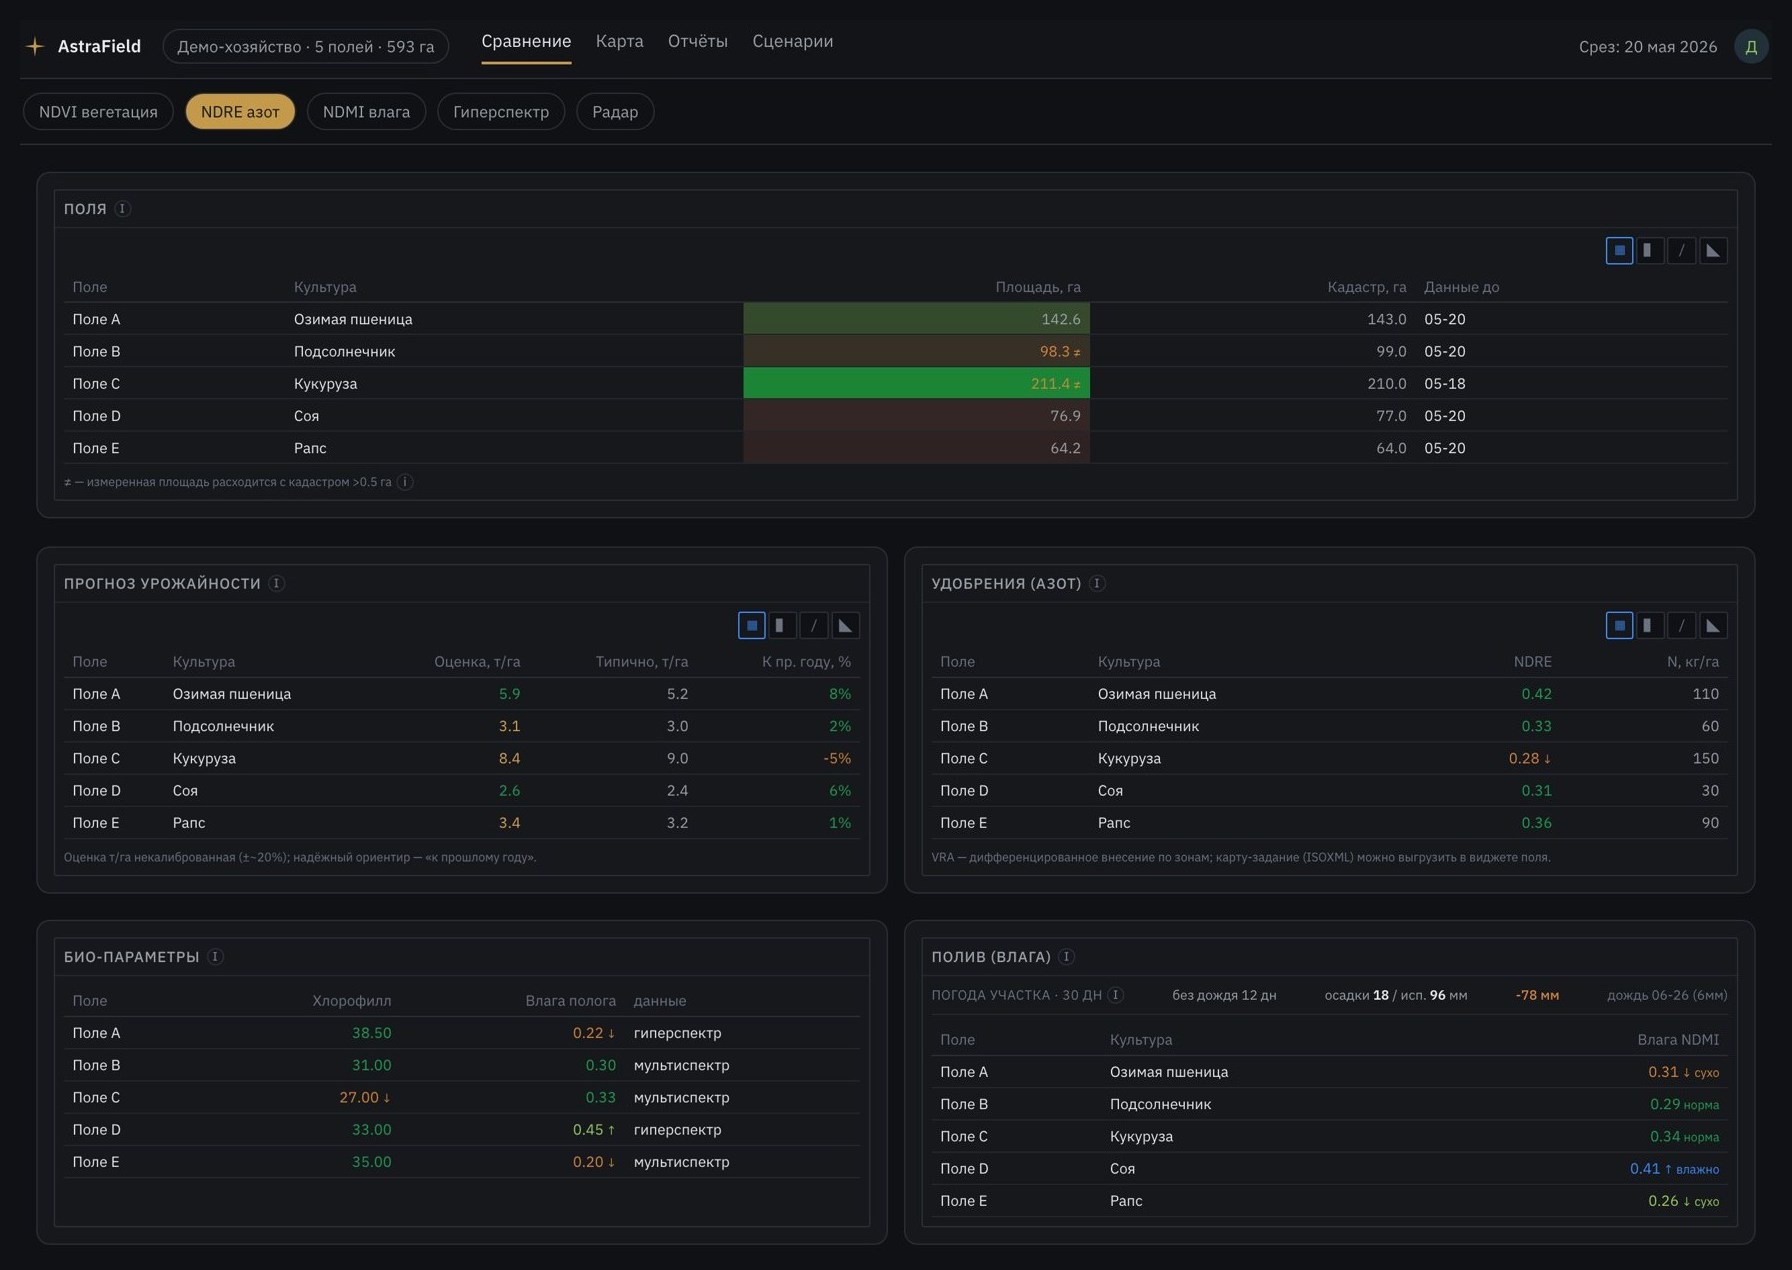
A single vegetation index tops out at around R² 0.57 accuracy. The red edge, hyperspectral, radar and calibration against combine data pull the forecast toward the line, up to R² 0.83 and above. Figures from peer-reviewed work; on a specific field the model is tuned over a season with ground data.
Agronomist+
Index maps, an all-field comparison, forecast and recommendations, reports. No Excel exports and no switching between fields: the agronomist's workspace on one screen.
Articles
Our channel
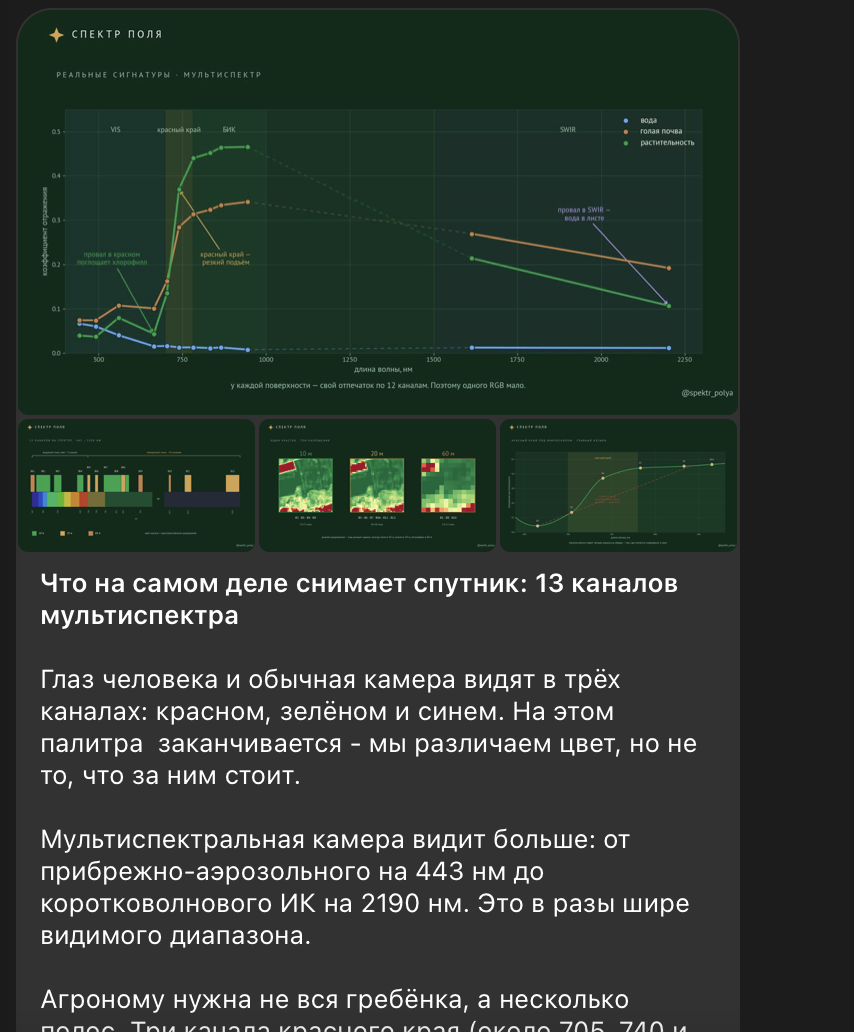
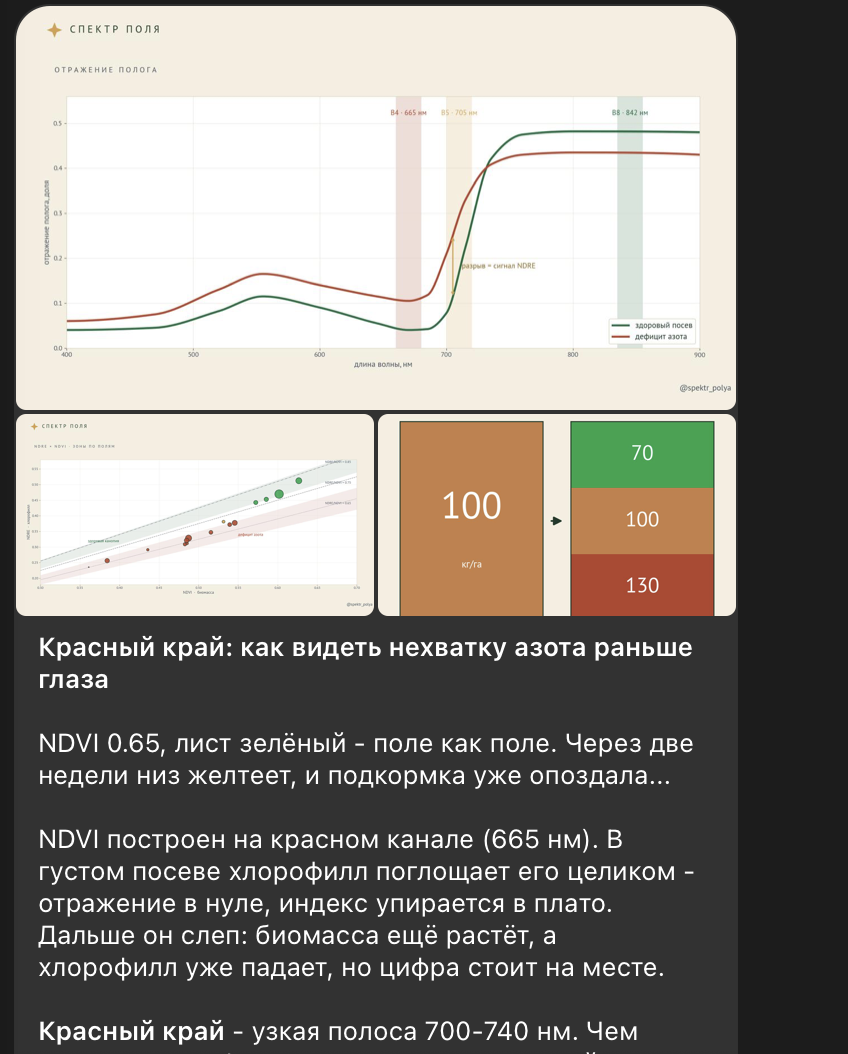
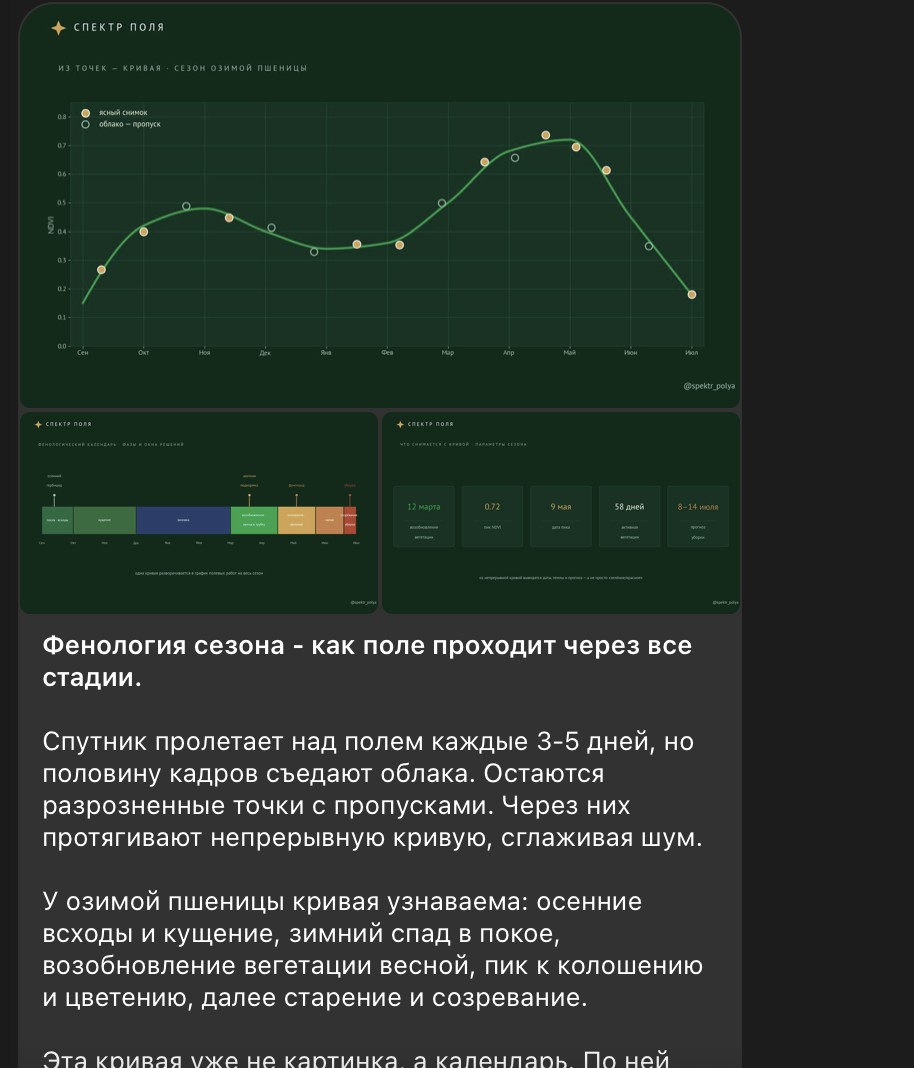
We break down satellite data on real fields: how the spectrum is read, what's visible from space and which decisions it changes. A few posts from the feed.
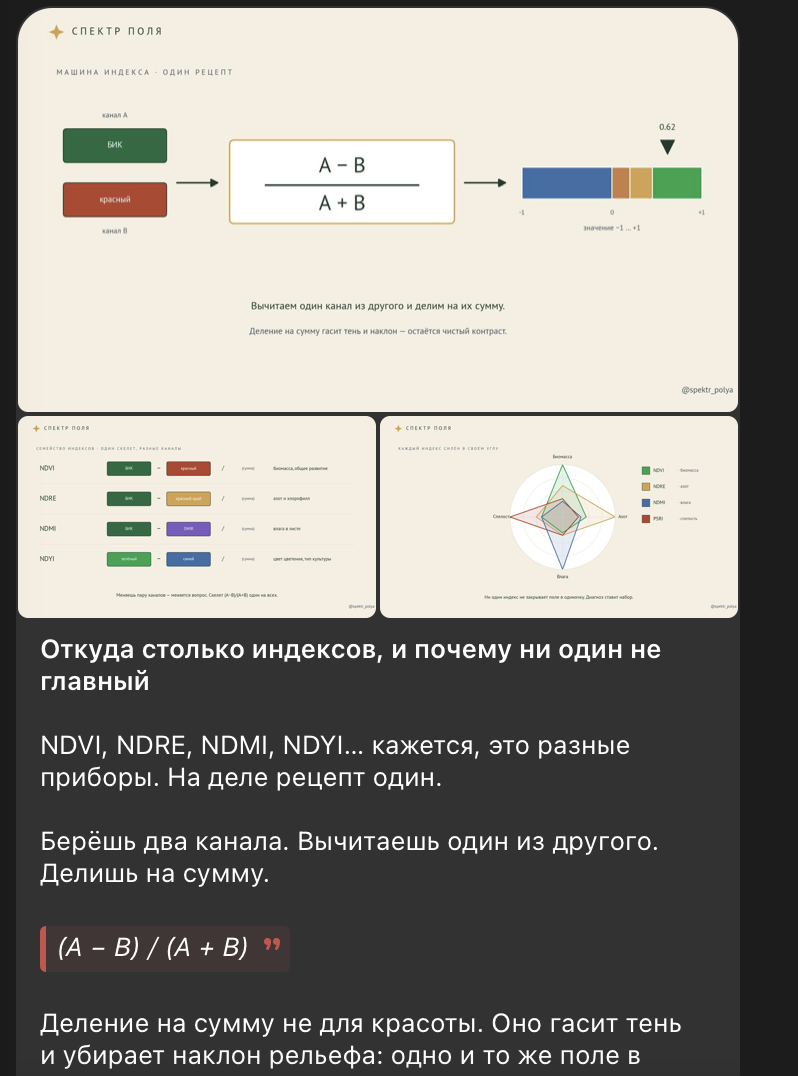
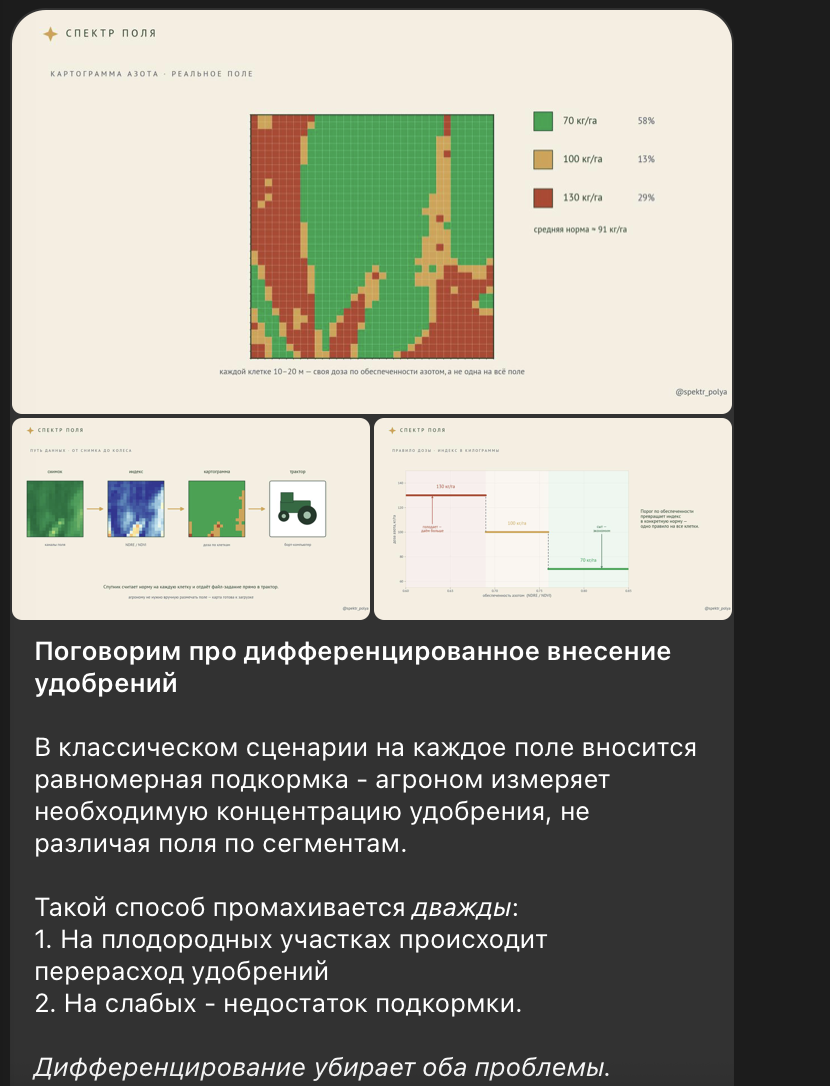
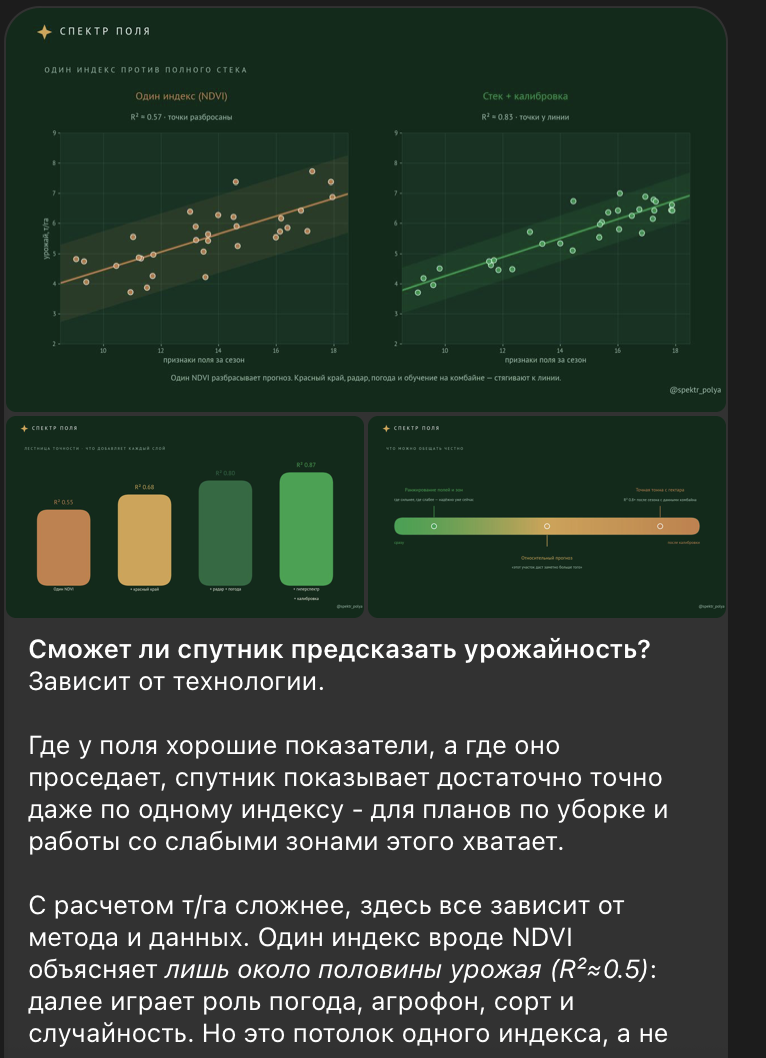
Swipe sideways · the full breakdown is in the channel
The agtech world
Why they trust us
A free pilot over your fields: we'll show the cause, the action and the result this season. If you already have a system, we'll put AstraField next to it.
Request accessCause. Confirmation. Action.
One product turns a field's spectrum into a concrete step. Start with a free pilot on your own fields.