An ordinary satellite image sees that a field is green. Hyperspectral imaging sees why it’s green, and where the green already masks trouble that’s begun. It’s the difference between a photograph and a blood test.
The human eye and most cameras split visible light into three broad buckets: red, green, blue. That’s enough to tell a healthy crop from a burnt one, but not enough to understand a plant’s condition before it changes colour. By the time a leaf yellows, the process that discoloured it has been under way for weeks.
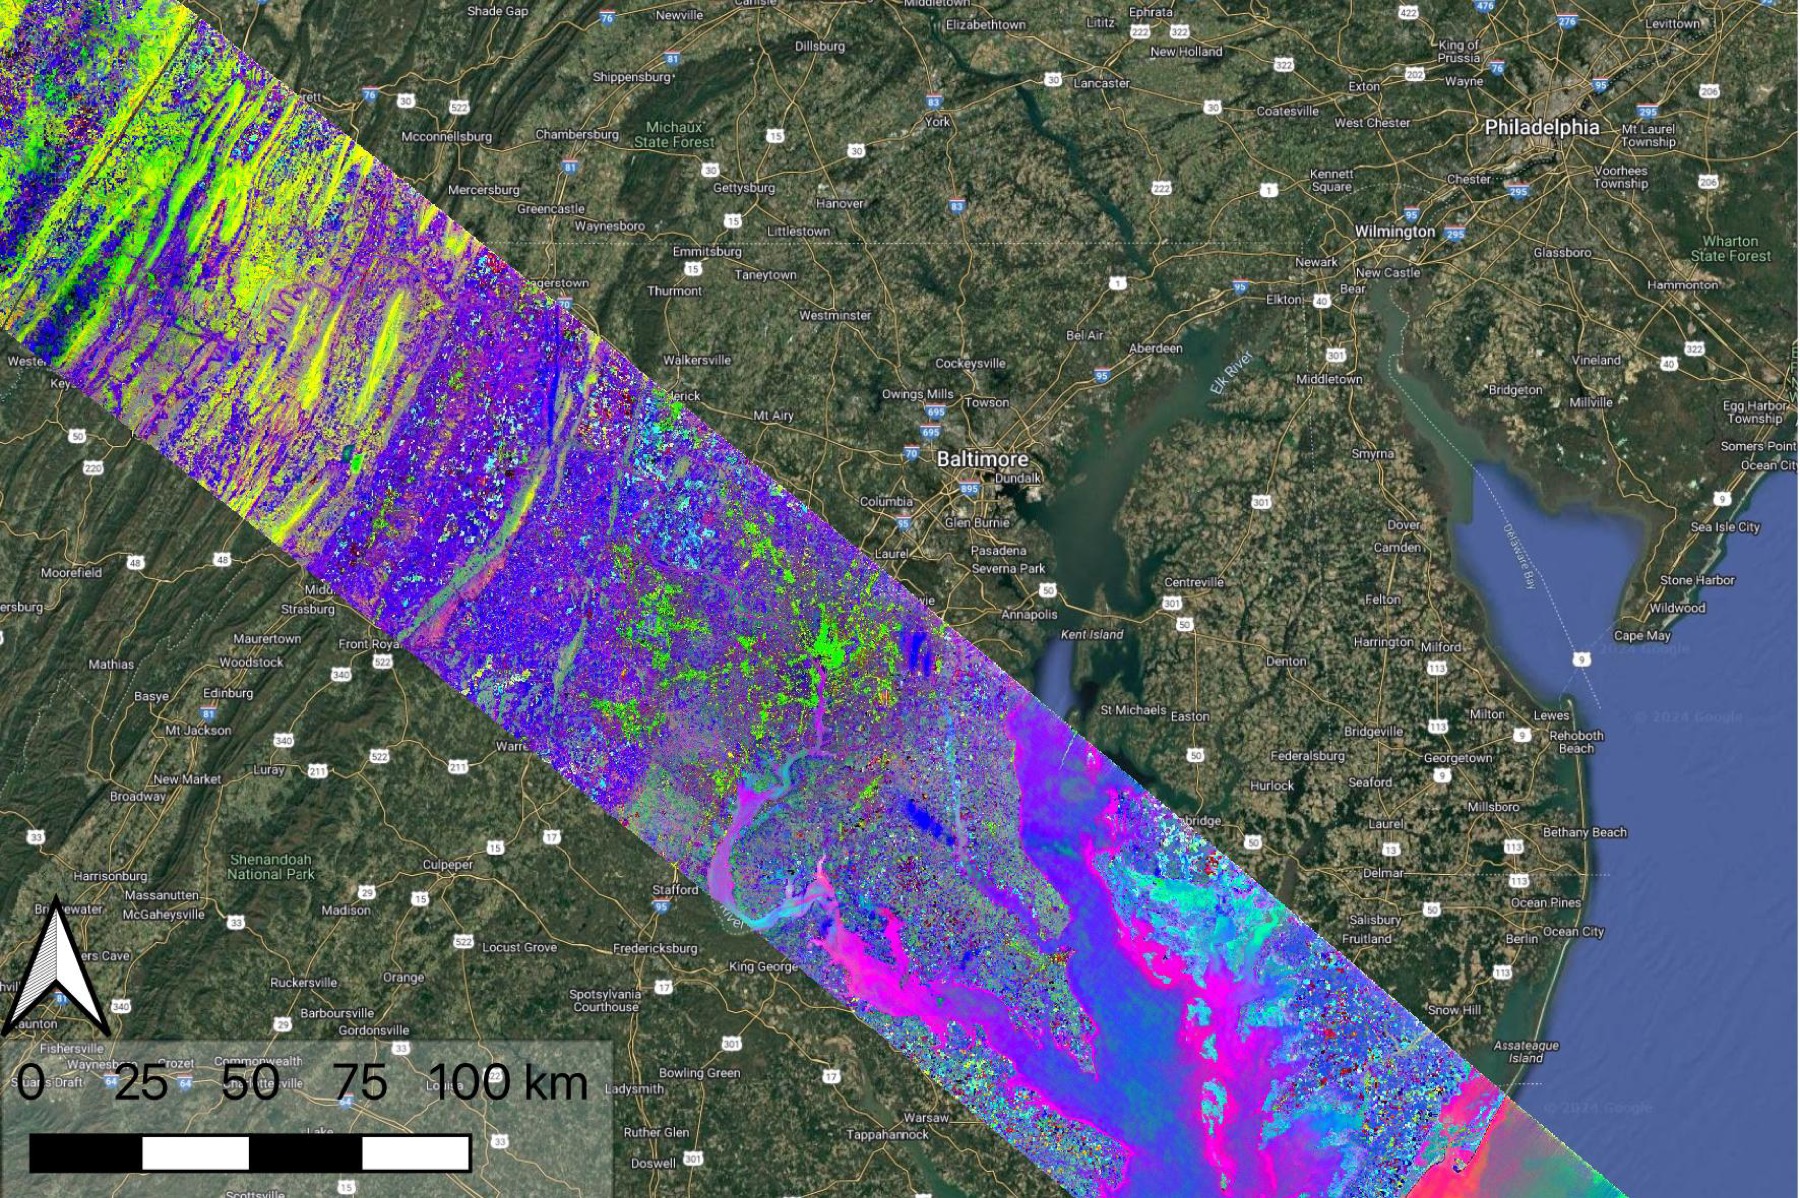
Hyperspectral imaging works differently. Instead of three or four broad bands it splits the light reflected off the canopy into hundreds of narrow, adjacent channels, effectively capturing a full spectrum at every point of the field. And a spectrum isn’t a colour. It’s a signature. Every substance in the leaf (chlorophyll, carotenoids, anthocyanins, water, cellulose, nitrogen compounds) absorbs and reflects light at its own, strictly defined wavelengths. By reading the shape of the spectral curve you can reconstruct what the leaf is made of at this minute, without touching it.
The spectrum as chemistry, not as colour
Imagine looking at a leaf not with your eyes but through an instrument that distinguishes the finest shades. In the short-wavelength part of the spectrum you’d see a dip: there the light was “eaten” by chlorophyll to feed photosynthesis. The depth of that dip tells you how much chlorophyll is actually working. Nearby, faint traces of carotenoids and anthocyanins show through, pigments the plant synthesizes when it defends itself against stress, cold or excess light.
At the boundary of the visible and near-infrared there’s a particularly eloquent stretch, the so-called “red edge”, a sharp jump in reflectance. Its position shifts by a few nanometres depending on how much chlorophyll and nitrogen are in the leaf. The shift is so subtle that an ordinary camera won’t notice it, but it’s exactly this that reacts first to nitrogen starvation, long before the leaf changes colour. Further out, in the shortwave infrared, water-absorption bands appear: from them you read the leaf’s water content, that is, whether the plant has enough moisture right now.
A broad-band image answers “is the crop alive”. Hyperspectral answers “what’s ailing it and how long before it becomes visible to the eye”.
What can actually be read
From the canopy’s spectral signature we reconstruct a whole set of biochemical and physiological traits, and we do it across the area, not at isolated sampling points.
Chlorophyll and the photosynthetic apparatus. Chlorophyll content is a direct indicator of how efficiently the crop turns light into biomass. Its decline is an early signal of stress, disease or a lack of nutrition.
Nitrogen status. Nitrogen in the leaf is closely tied to chlorophyll, and the “red edge” lets us assess the crop’s nitrogen supply differentially across the field: where top-dressing is needed and where it would be wasted.
Protective pigments. A rise in the share of carotenoids and anthocyanins relative to chlorophyll is the plant’s biochemical “temperature”. The crop still stands green, but the spectrum already shows it has shifted into defence mode.
Water in the leaf. Leaf moisture content is drought read not from a weather forecast but from the plant itself. A field can look normal while the spectrum already records a moisture deficit that has begun.
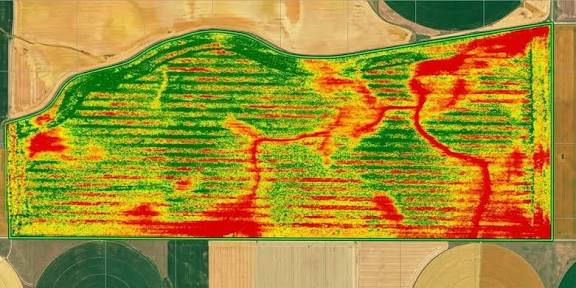
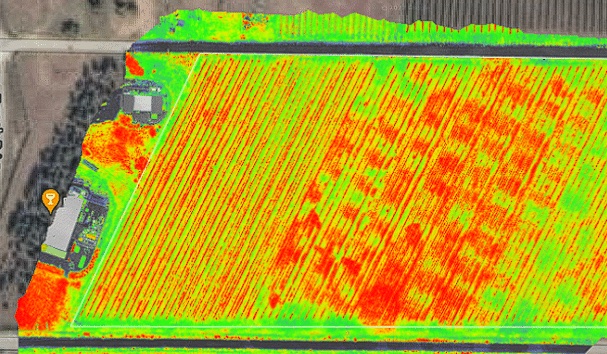
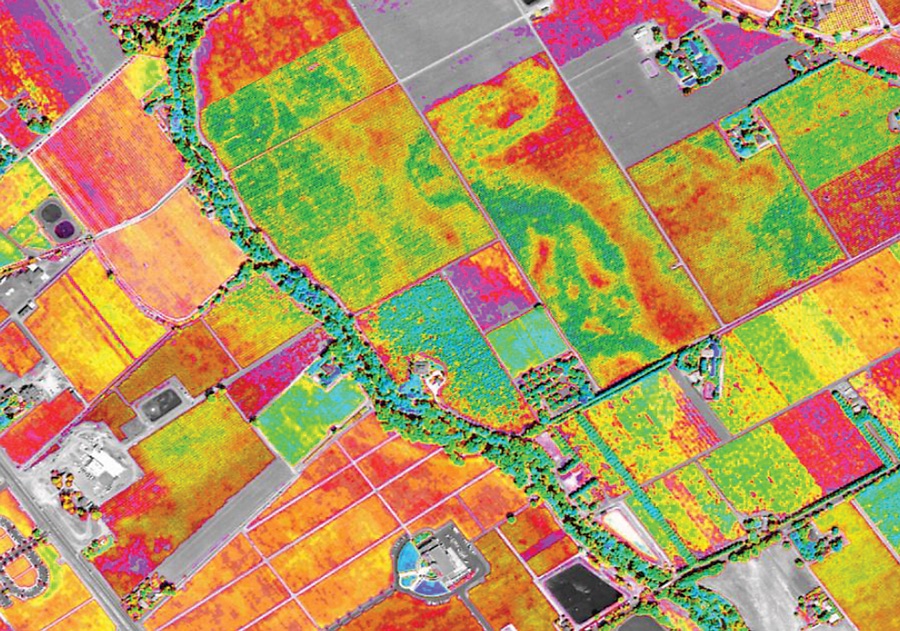
The key thing here is that all these quantities are extracted from one and the same acquisition at once and as continuous coverage. An agronomist with a test strip and a lab gets a few points over hundreds of hectares. Hyperspectral gives a map where every part of the field is shown with its own biochemistry.
Honest about the method’s limits
Hyperspectral is a powerful tool, but not a magic one. Narrow channels carry less light, so the imaging is sensitive to cloud and atmosphere; the data has to be carefully calibrated, bringing “what the sensor saw” to “what the plant actually reflects”. High-resolution hyperspectral imaging doesn’t yet cover vast areas as often as wide-swath multispectral systems.
So we don’t set the methods against each other, we add them together. Radar works in any weather and through cloud, giving an all-weather base. Multispectral provides frequent, wide coverage. Hyperspectral adds depth, the biochemical detail where you need to understand not “what” but “why”. We check the calibration and geolocation against the pilot’s ground data, so the spectral signature from space matches the field’s real condition.
What it gives the farm
Hyperspectral analysis moves the conversation about a field from “looks good/bad” to measurable causes. The farm gets not a picture but an early warning: where nitrogen starvation is beginning, before any yellowing; where the crop has shifted into stress, while it’s still reversible; where moisture is short, before it hits the yield.
In practice that means three things. Top-dressing and treatments can be aimed precisely rather than blanket: where the spectrum showed a deficit, and not where everything is fine. Problem areas are found weeks earlier, when intervention still makes sense. And the accumulated spectral maps turn into a field history, a factual base for decisions on varieties, timing and rotation. This isn’t a replacement for the agronomist. It’s their sight, widened to hundreds of channels, and a memory that doesn’t fade between seasons.