When a decision about thousands of hectares is made from someone else’s week-old image, the question is no longer only about its accuracy. It’s about how closely you can even examine your own field, and whether that frame can be cited. Access to sovereign high-resolution imagery closes exactly this gap, and along the way it changes which on-the-ground tasks can be solved from space.
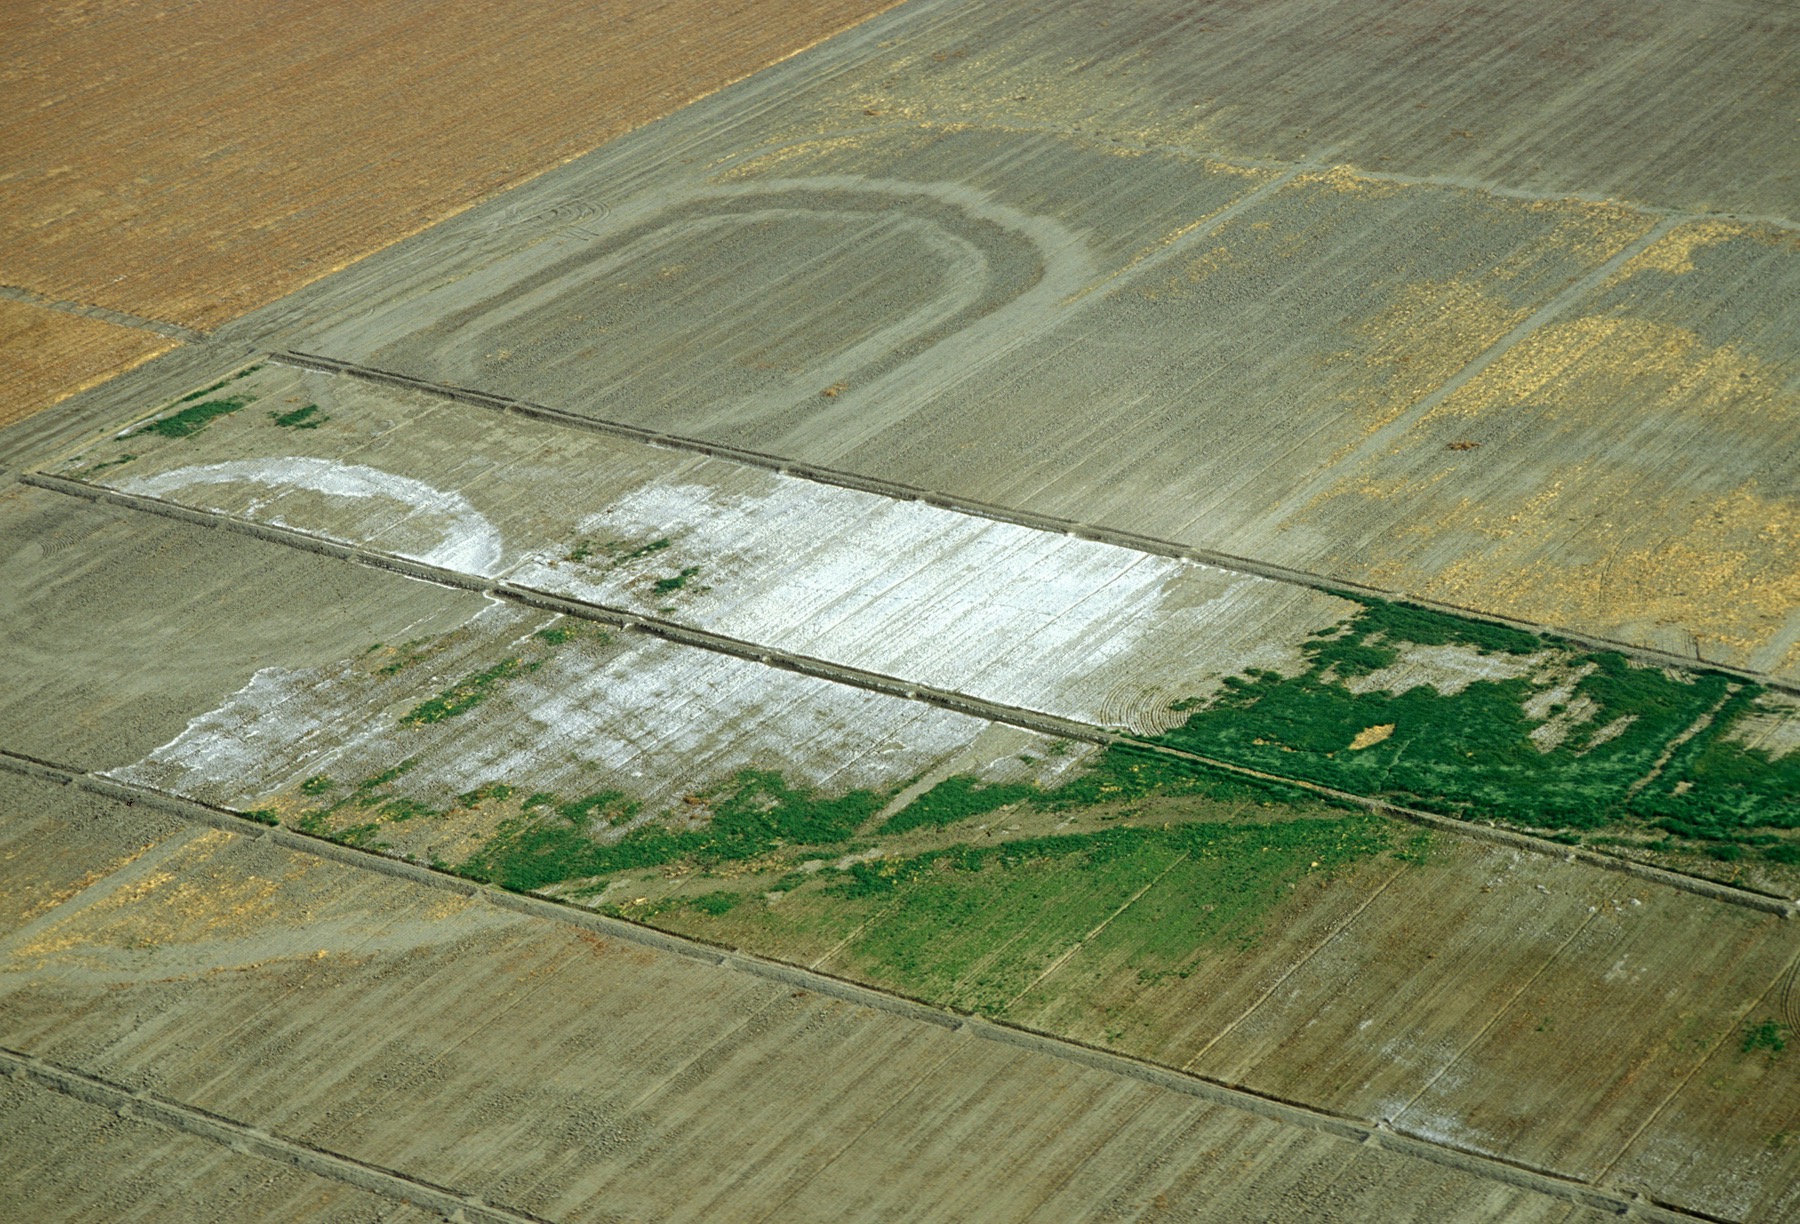
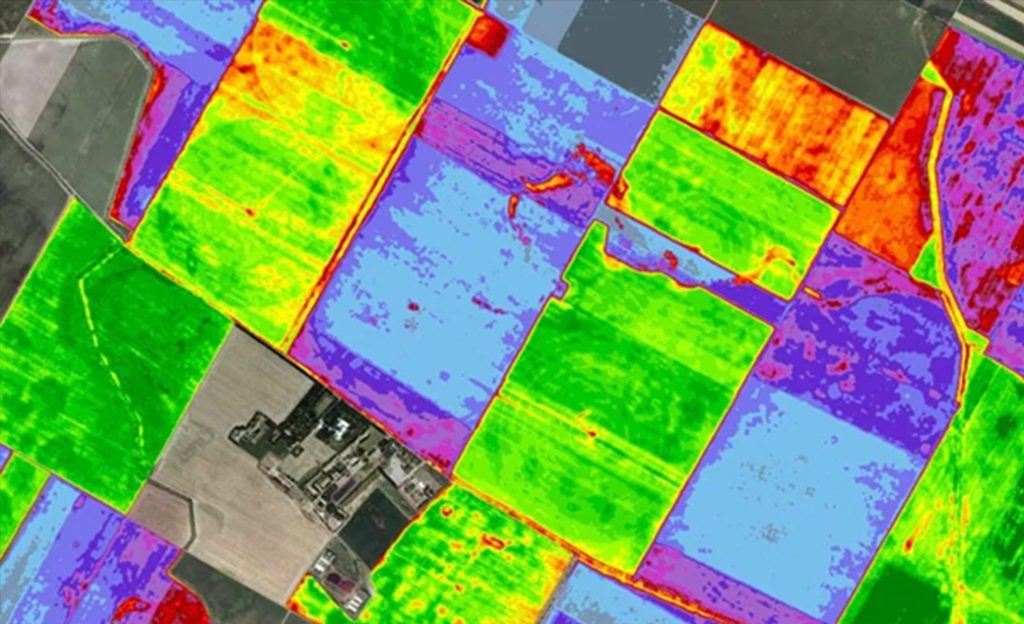
Agricultural analytics long lived on what was available: open multispectral and radar data, captured on someone else’s schedule, processed to someone else’s standards. That was enough to see a field “on average”: the state of the canopy, the dynamics of greenness, large stress zones. But as soon as it came to detail (a boundary, an access road, whether a specific parcel is actually sown or only listed as sown) the resolution stopped being enough.
High-resolution imagery closes exactly this gap. And it’s not only about a pretty picture.
What “sovereign data” means in practice
Sovereignty here refers to the origin and quality of the data, not to owning a satellite. It’s two concrete properties.
The first property is control over quality and standard. When it’s clear how an image is calibrated, how it’s georeferenced and what the real acquisition date is, the picture turns from an “illustration” into evidence you can cite in a dispute with a contractor or when reconciling against a declaration.
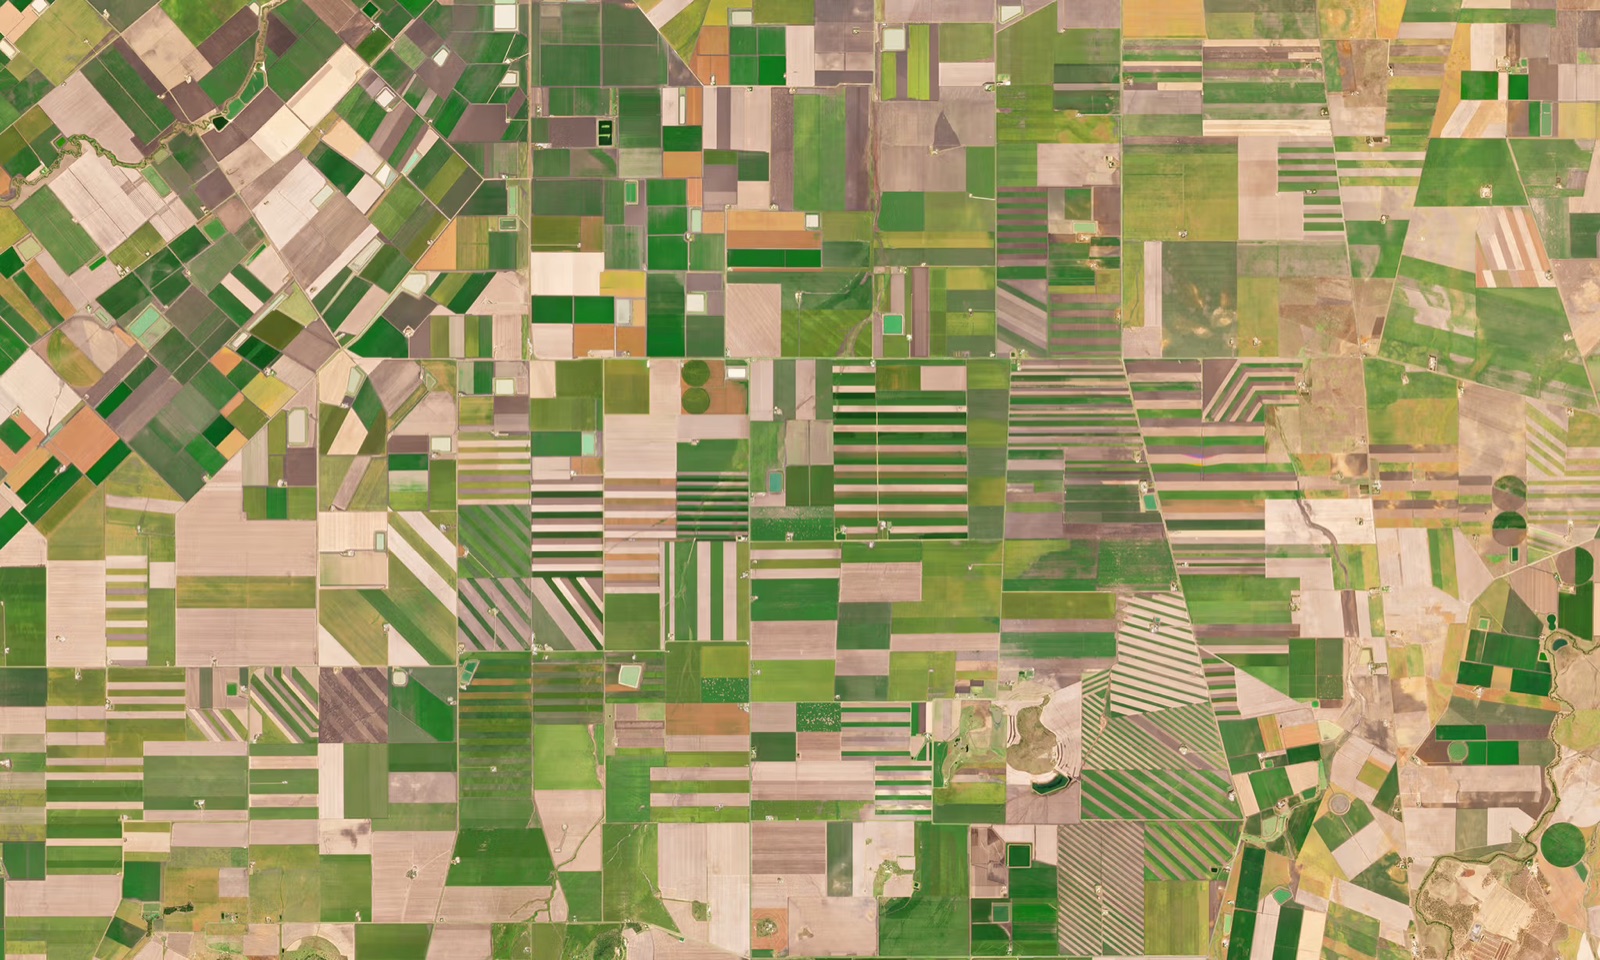
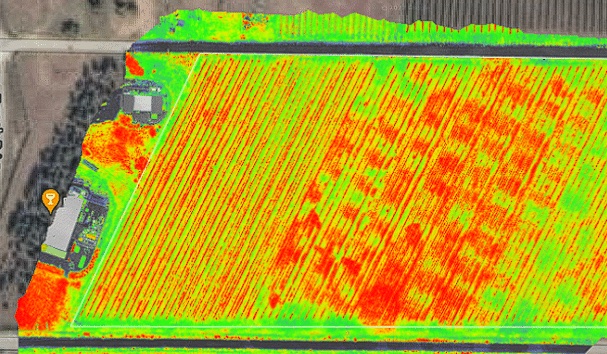
The second property is detail fit to the task. High resolution is needed not for resolution’s sake but to distinguish the objects that decide everything in agronomy: the line between treated and untreated, a bare patch the size of a parcel, a tramline, the edge of fallow.
Open data shows that the field is green on average. High-resolution imagery shows that this twelve-hectare corner isn’t sown at all, and does it at a resolution where the fact can no longer be disputed.
Where detail changes the result
The most obvious case is the area audit. Sown or not, exactly how many hectares are in work, does the actual outline match the cadastre and what the contractor declared. On a coarse image, ten unseeded hectares inside a large field dissolve into the general green. On a detailed one they’re visible as a fact, with coordinates and a date. This is a direct tool for controlling contractors and reconciling with declarations.
The second case is verifying anomalies. Radar and multispectral show well that vegetation has dropped somewhere on the field. But “something’s wrong” is a signal, not a diagnosis. Detailed imagery lets you look at that spot up close: flooding, a soaked patch, a seeder miss, trampling, loss of emergence on a slope. A coarse index says “go and sort it out”; a high-resolution frame often says straight away “here’s what’s there”.
The third case is fallow and bringing land back into use. To decide what to do with an overgrown parcel you first need to see its boundaries and degree of overgrowth honestly. Detailed imagery separates real arable from what long ago became weeds, and helps plan the parcel’s return.
Why it only works in combination
It’s important to be honest: no single data type covers everything. The strength isn’t in “the coolest satellite” but in layers that complement each other.
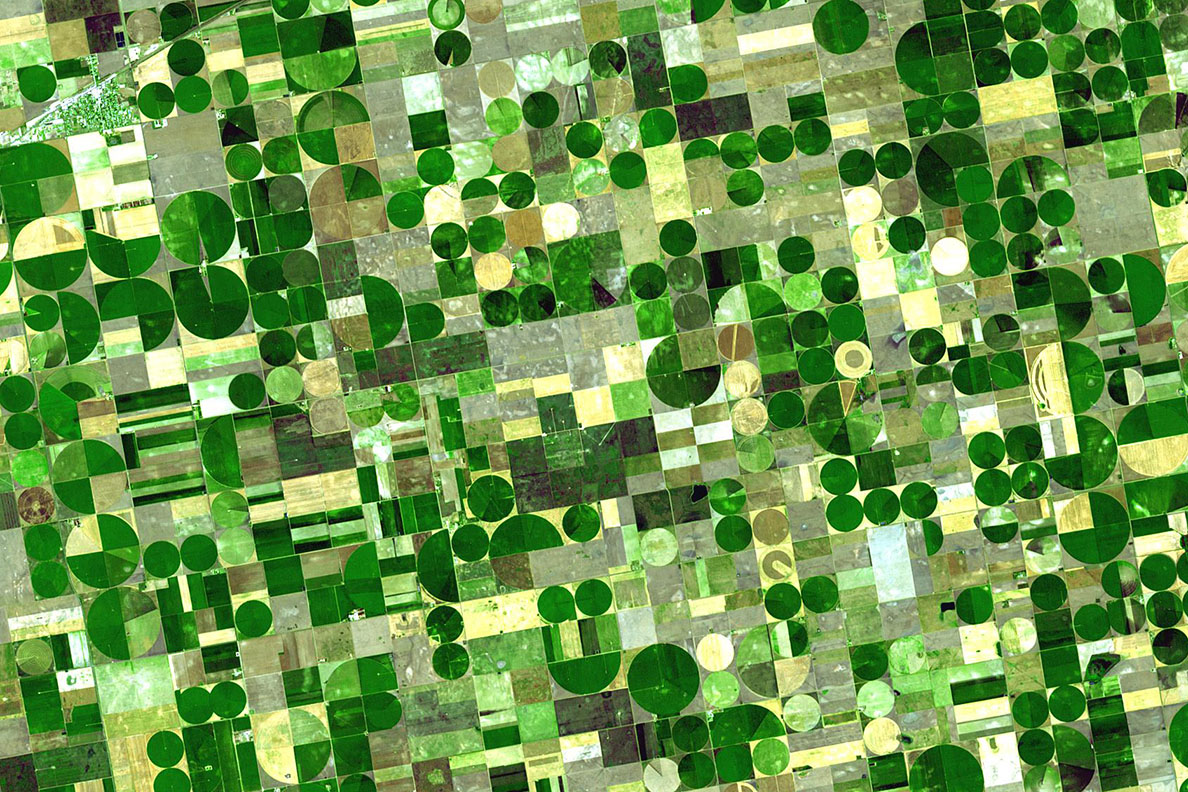
Radar sees through cloud and works all-weather; it keeps observation continuous where optical goes blind under the south’s weeks-long overcast in the off-season. Multispectral gives a regular, frequent picture of canopy condition over large areas, the workhorse of monitoring. Hyperspectral adds biochemical depth, the fine differences in pigments, nitrogen and leaf moisture that ordinary channels can’t reach. And high-resolution imagery comes in where you need to confirm, measure the outline and present evidence.
Each layer answers its own question. High-resolution imagery doesn’t replace regular monitoring, it makes its conclusions verifiable and weighty. Regular monitoring, in turn, tells you where to aim the detailed imagery so as not to shoot everything blind.
Honest about the limits
High-resolution imagery isn’t “we see everything always”. High resolution and frequent revisit are in natural tension: the more detailed the frame, the narrower the swath and the rarer the repeat over one point. So such imagery works as a targeted tool. It’s applied to a specific task (a disputed outline, a detected anomaly, a parcel for return to use), while the background is held continuously by regular data. And we say it plainly: for us high-resolution imagery is a capability we bring in on request for a task, not a constant layer of daily monitoring.
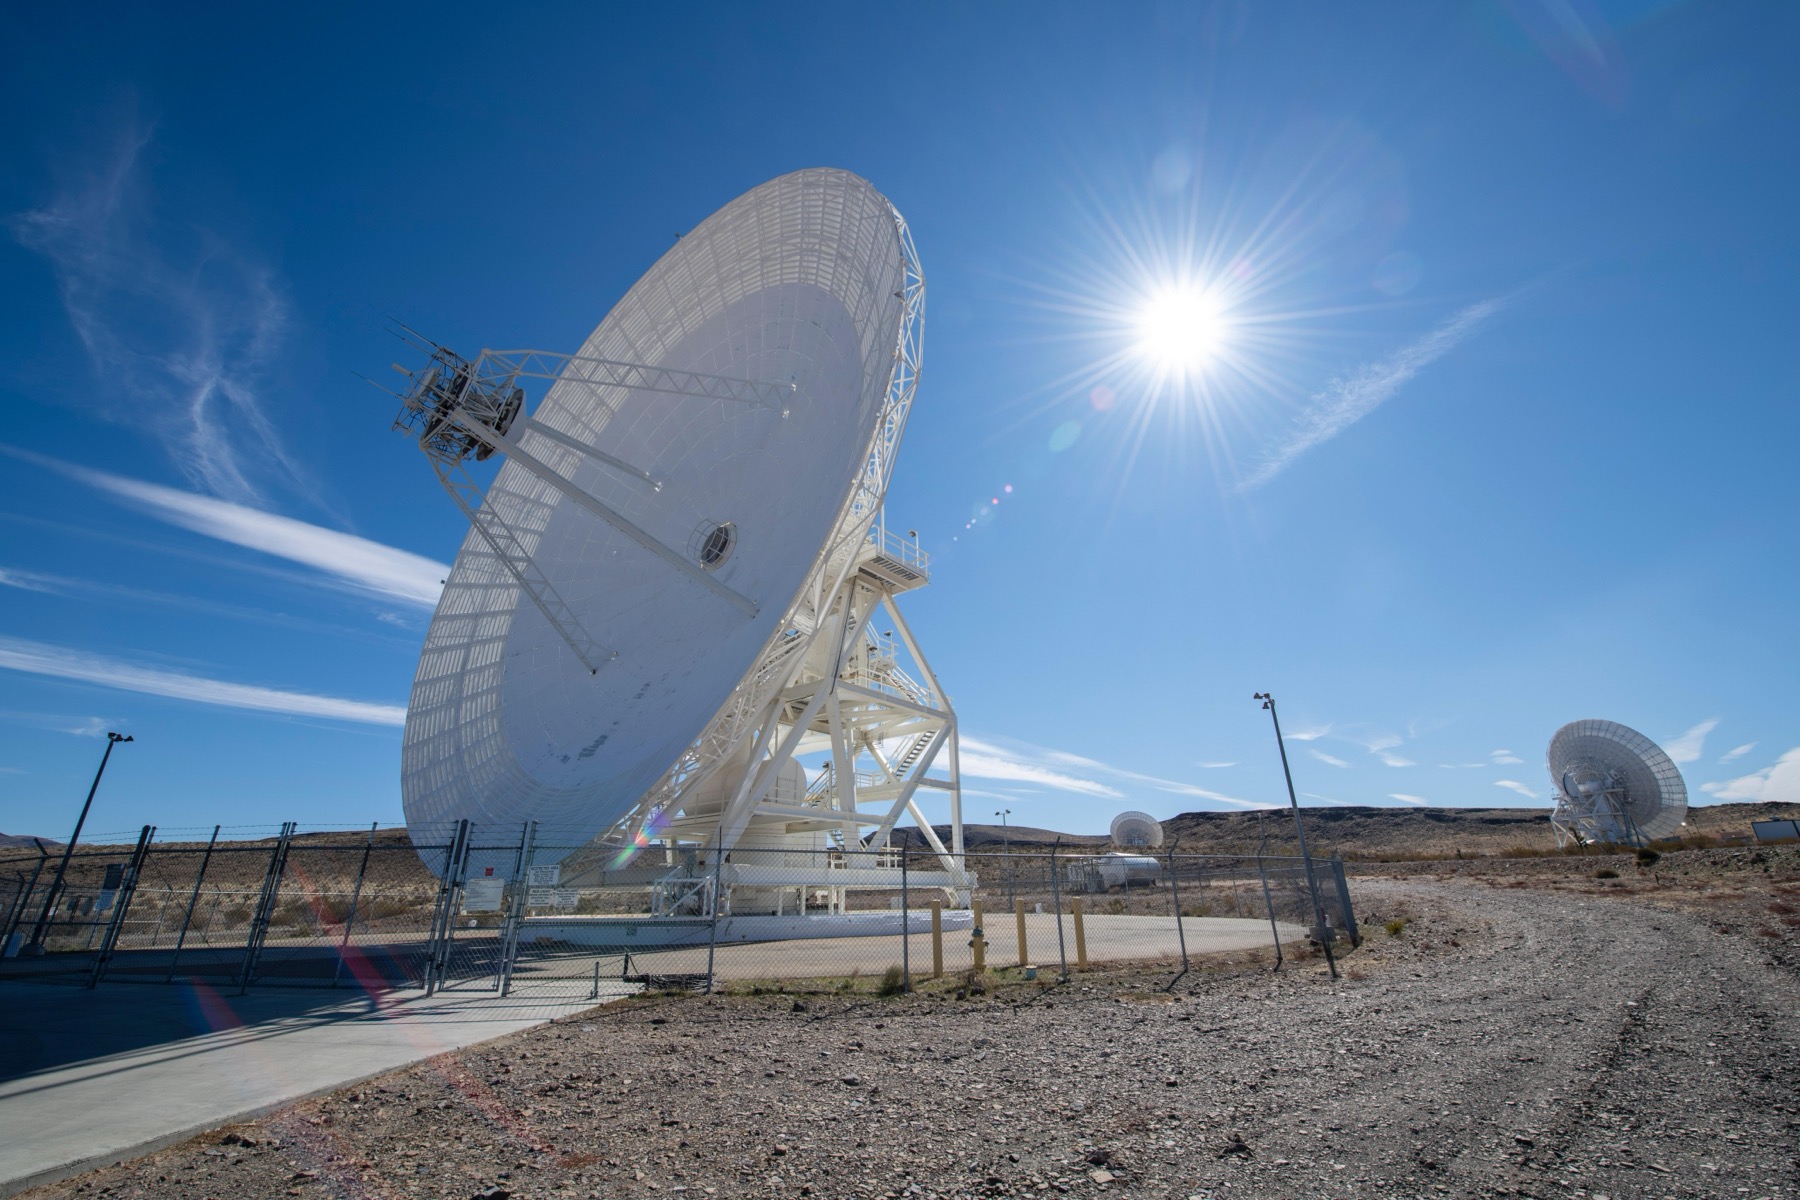
That’s exactly why we build our analytics on a stack, not on a single source. The value isn’t in owning a satellite as such, but in having detailed data at hand precisely when a decision and money depend on the frame.
What it gives the farm
- Control instead of taking someone’s word. Sown area, treatment boundaries and a contractor’s work can be seen and recorded, not accepted from a report.
- Evidence, not an illustration. A frame with a clear date and geolocation is fit for reconciling with the cadastre and the declaration, and for resolving disputes.
- A fast jump from signal to diagnosis. Where monitoring showed an anomaly, detailed imagery answers what exactly happened, before a trip to the field.
- Precision fit to the task. Detailed data is brought in where the farm actually needs it, without overpaying for blanket high-resolution imaging of everything at once.
Detailed data about a field isn’t about a space race. It’s about ceasing to manage land from coarse images and starting to make decisions from facts you can verify.