Multispectral: where it differs
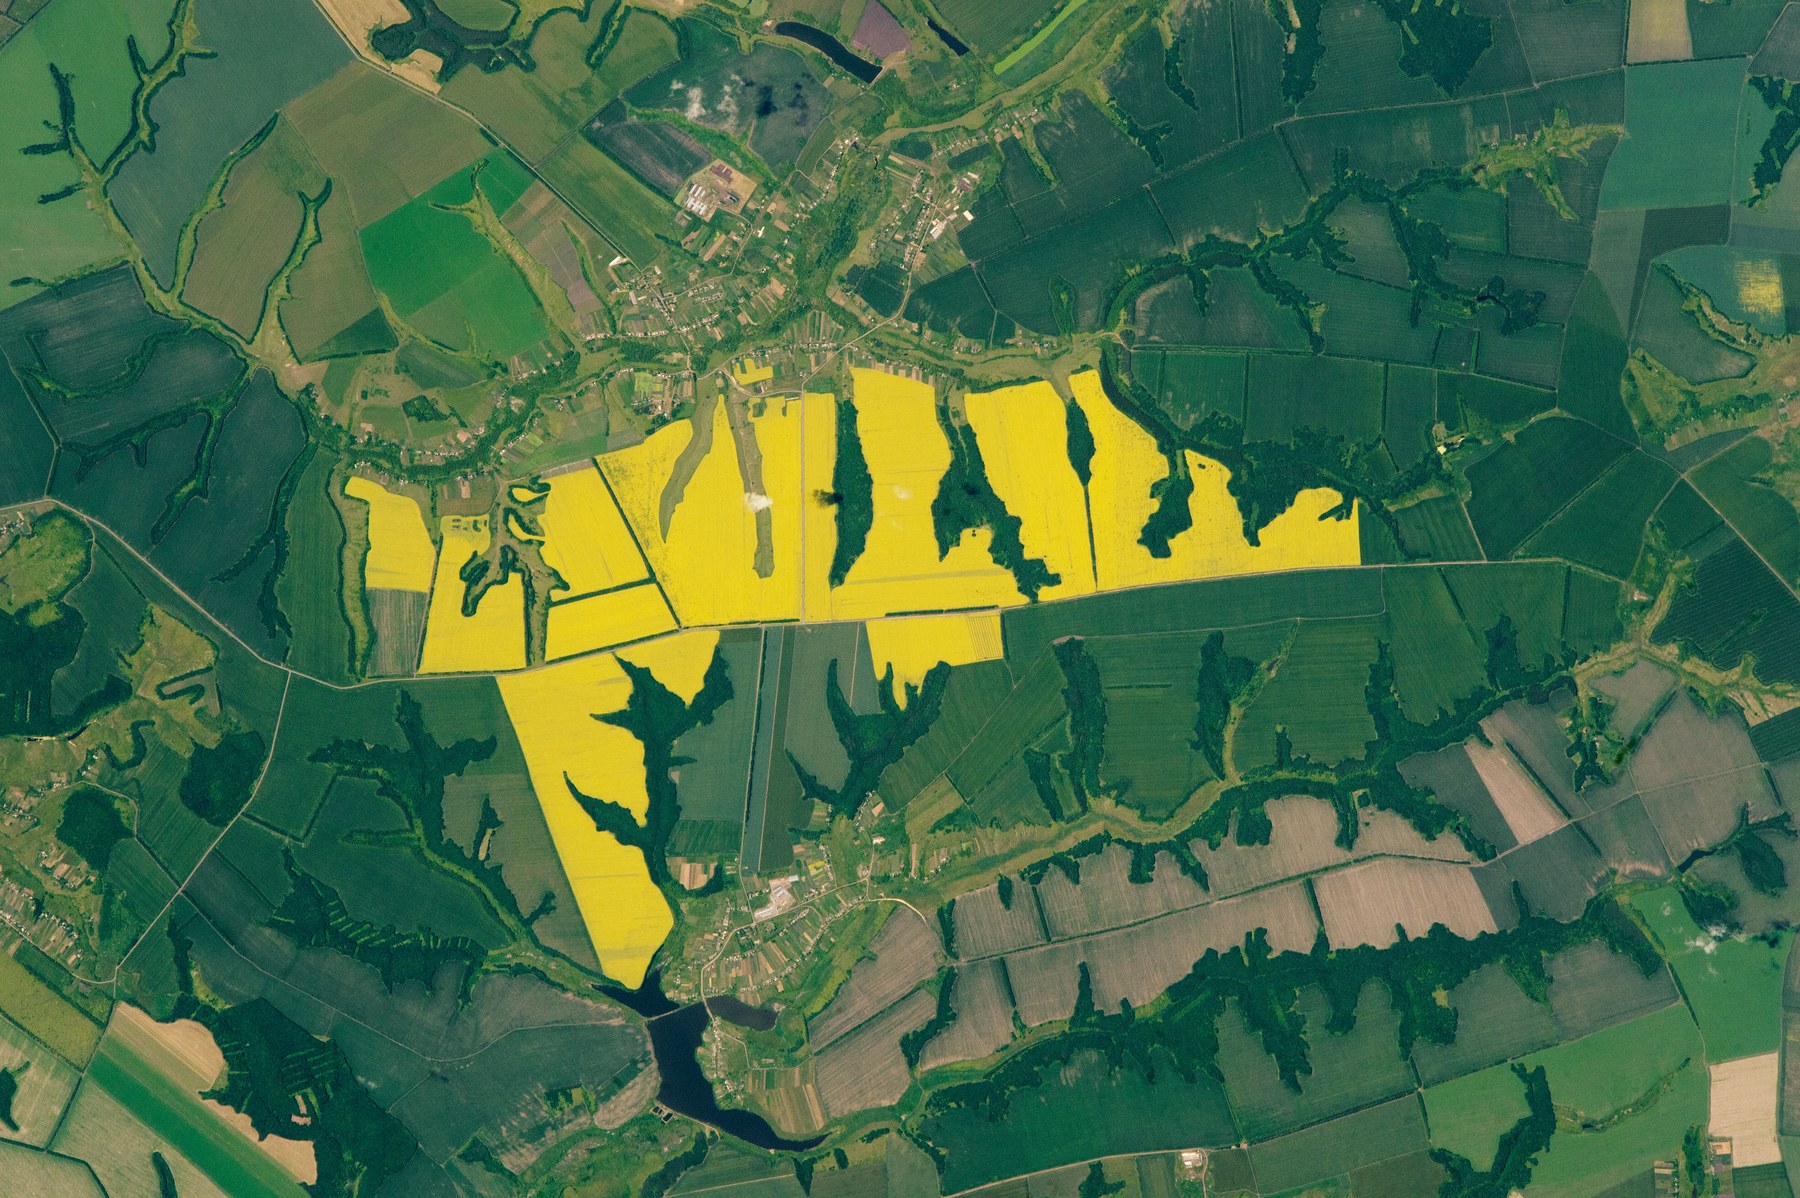
A vegetation index reliably shows that a patch is unlike its neighbour, and how differently the zones have developed. That's the base, but it isn't yet the cause.
Science & practice
Fine words about the future are worth nothing without evidence. Not “trust our hyperspectral magic”, but a structured base: science, our cases and operational metrics. We don't say “it works perfectly”. We say “verified, with a confidence level and honest limits”.
 nitrogen moisture normal confidence 81%
 Layer 1 · Research base
A vegetation index sees greenness and biomass. Narrow biochemical and physiological signals (chlorophyll, the red-edge shift, water absorption, pigments) are read from a denser spectrum and from all-weather radar.
A vegetation index reliably shows that a patch is unlike its neighbour, and how differently the zones have developed. That's the base, but it isn't yet the cause.
Where multispectral sees a few colours, hyperspectral sees hundreds of bands: chlorophyll, the red edge, pigments, water absorption. The red edge is closely tied to leaf chlorophyll and nitrogen status.
Radar is all-weather, day and night. It keeps observation continuous where cloud jams the optical for weeks, and it senses moisture and canopy structure.
The spectrum gives a hypothesis; a soil and tissue sample, scouting and a drone confirm it. The model is calibrated on the farm, it doesn't pass off someone else's percentages as yours.
Layer 2 · Our cases
Every case is built on the same scheme: signal, diagnosis, confirmation, action, result. With a confidence level and explicit limits. Pick a case.
Layer 3 · Operational metrics
On every pilot we measure operational results, not “pretty maps”. Including an honest false-positive rate.
Prove that something real was found, not noise.
The value of replacing a weak diagnostic layer.
The agronomic value of the decision.
A direct resource saving.
Value for the process and the agronomist's time.
Value for the machinery.
Service value and confirmation.
We show it: this is about trust, not gloss.
Benchmark
Keep your current system. We run AstraField over the same fields, the same dates and with the same agronomists and compare confirmed decisions: nitrogen, moisture, unseeded hectares, scouting priorities, task maps and the false-positive rate.
Let AstraField run alongside for 6-8 weeks. If we don't find confirmed decisions your system missed or confused, then don't roll us out.
Cause. Confirmation. Action.
One product turns a field's spectrum into a concrete step. Start with a free pilot on your own fields.