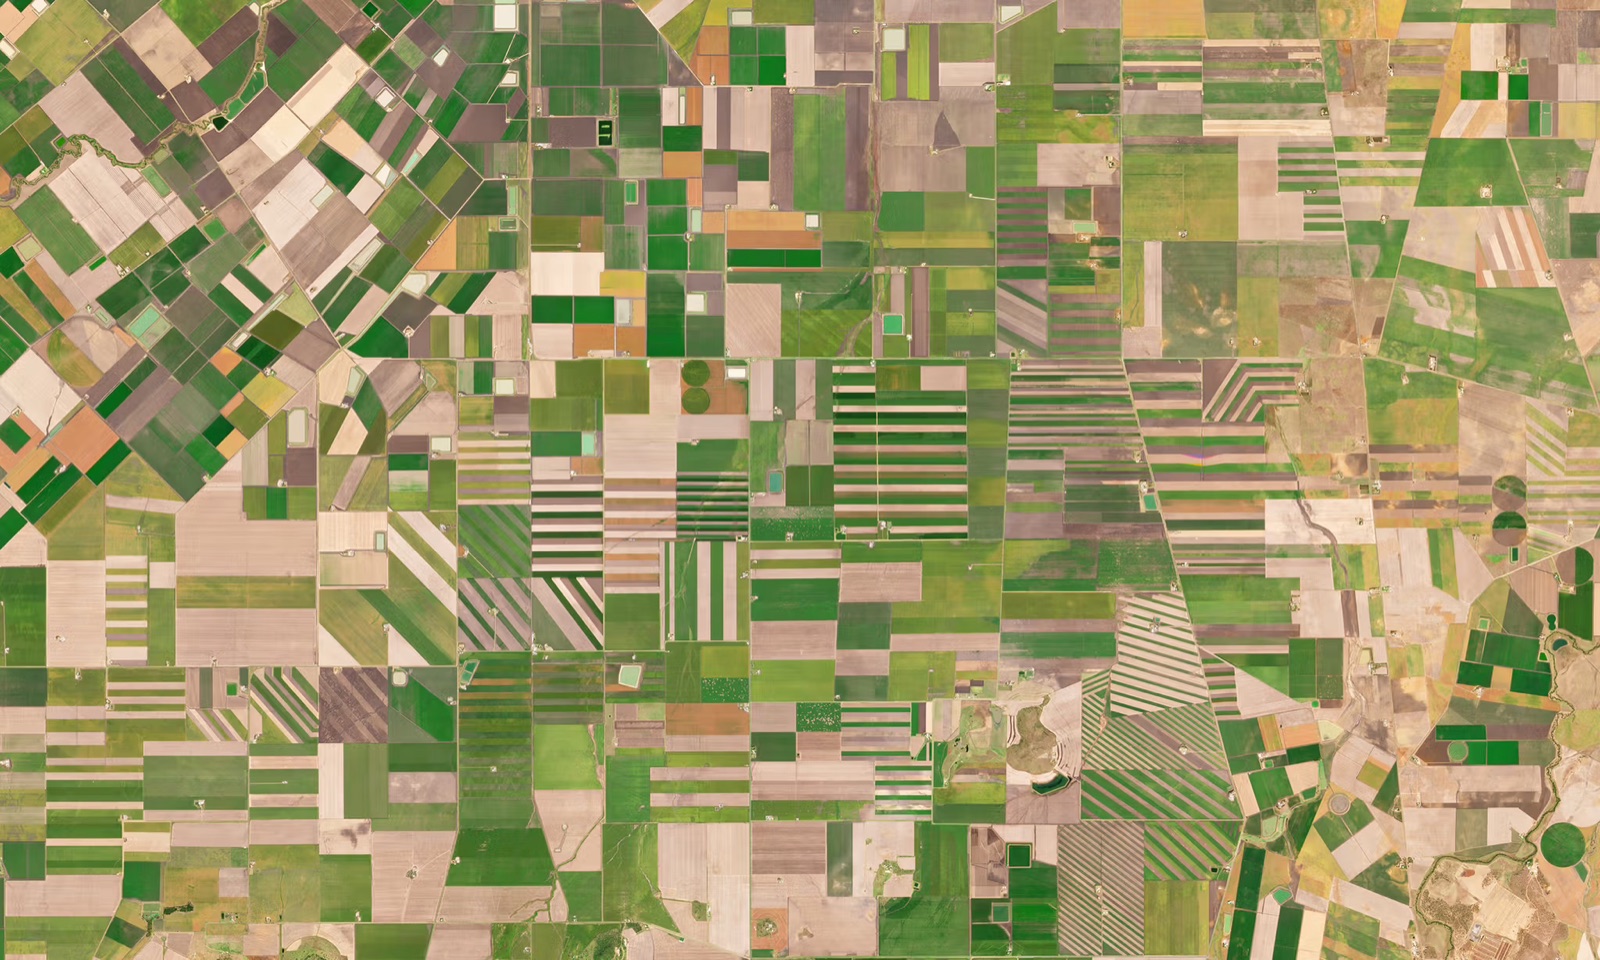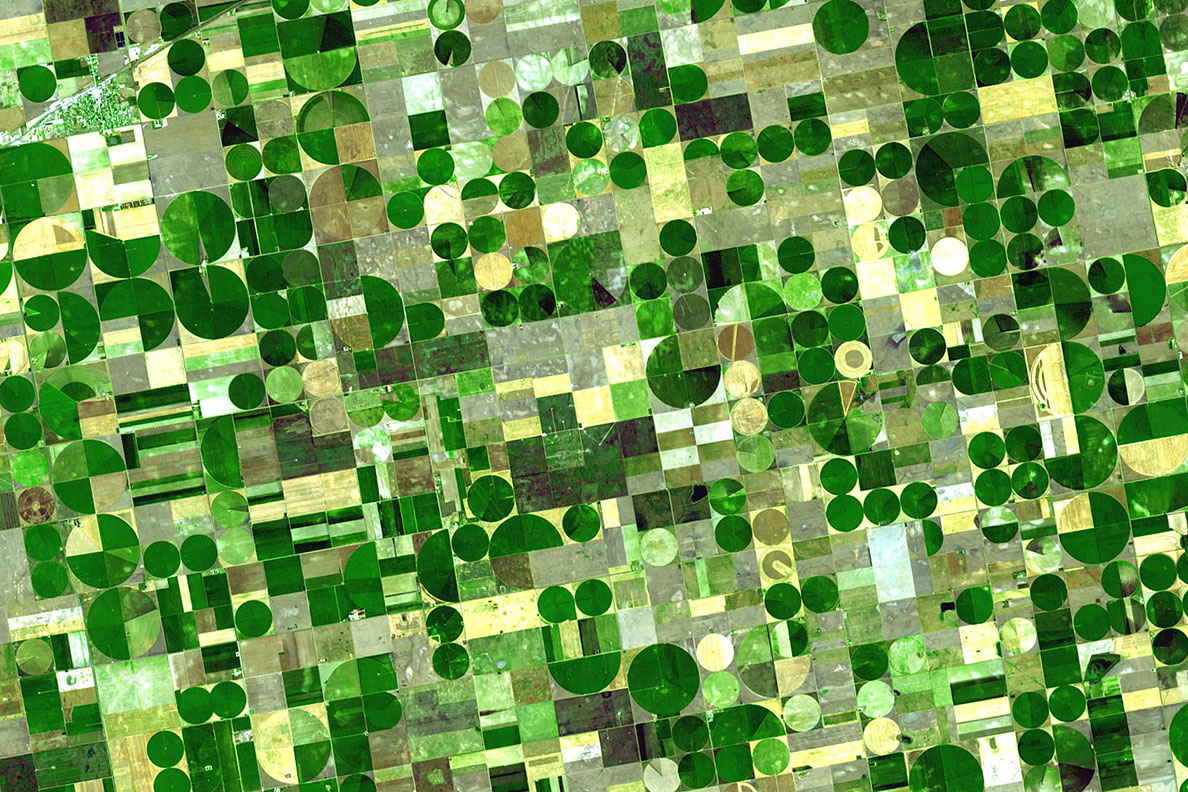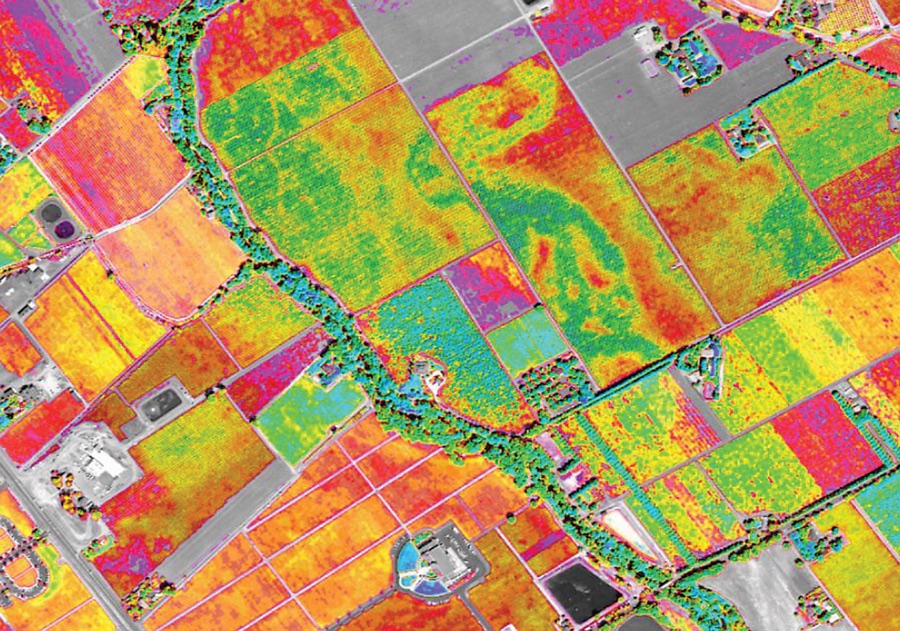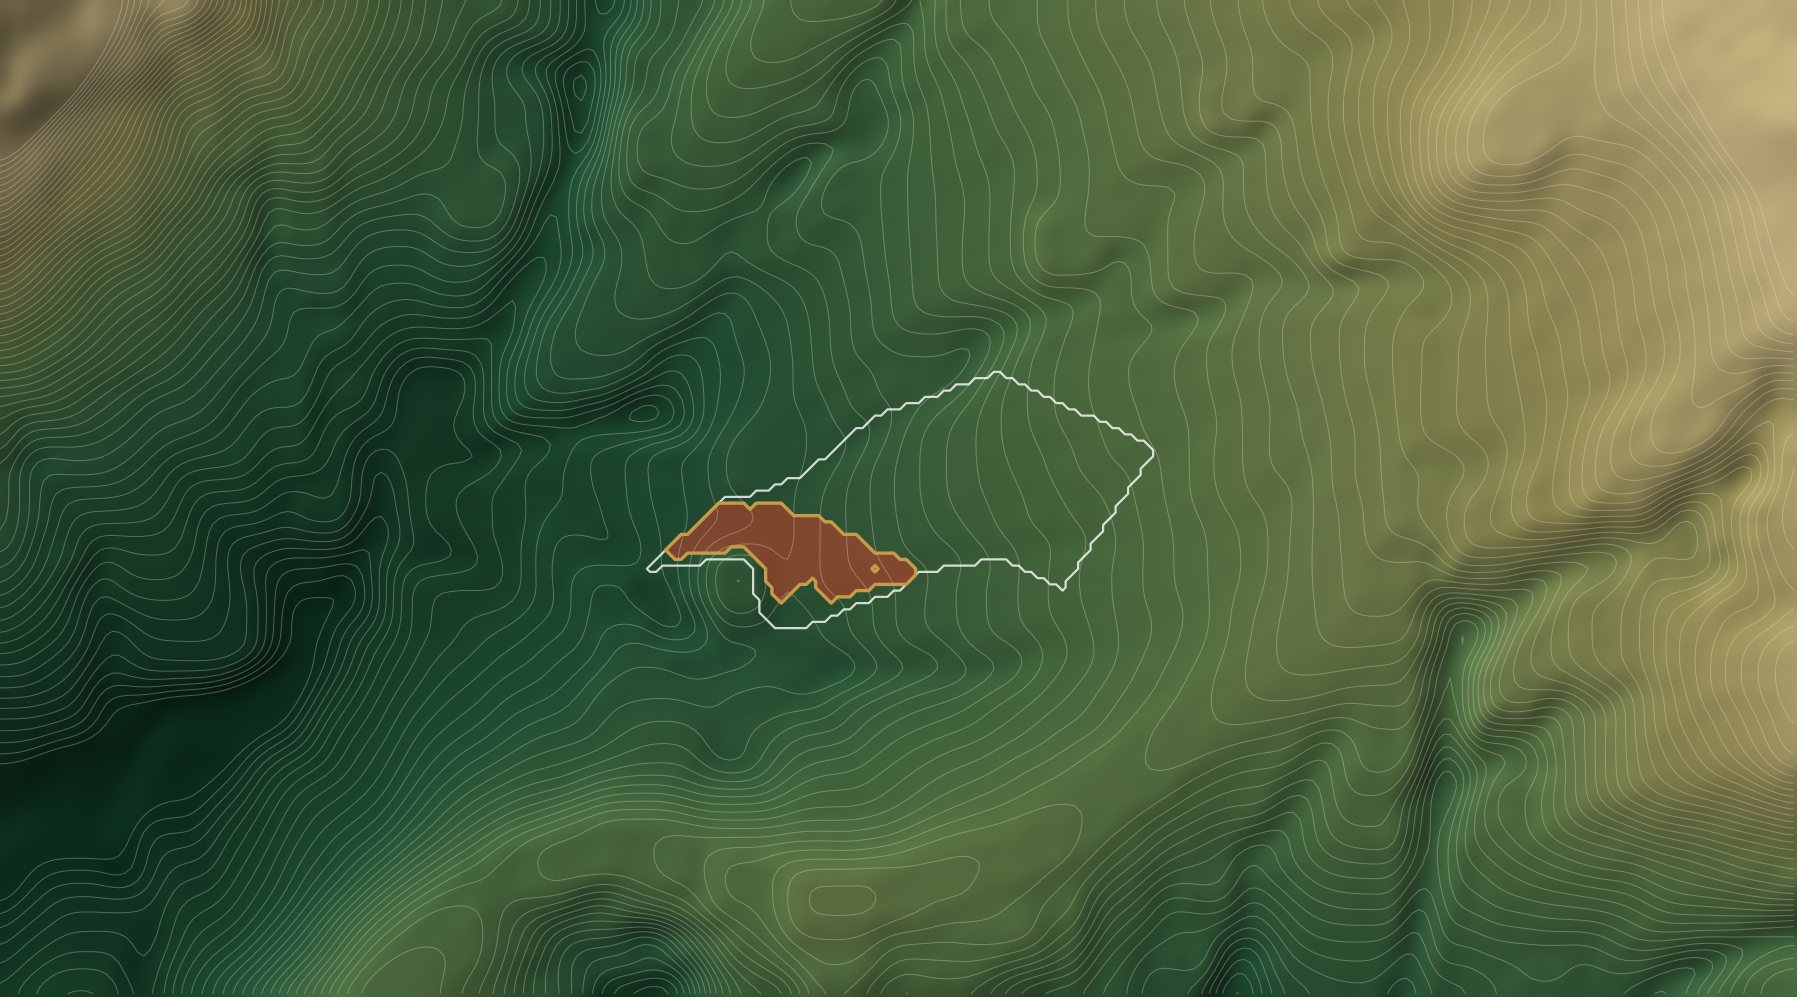
A satellite sees well that part of a field is weaker than the rest. Why, a single index cannot tell. On a pilot field we followed one such strip from autumn to spring and saw that relief decided everything. Since then relief has been part of the diagnosis in the AstraField terminal.
What happened on the field
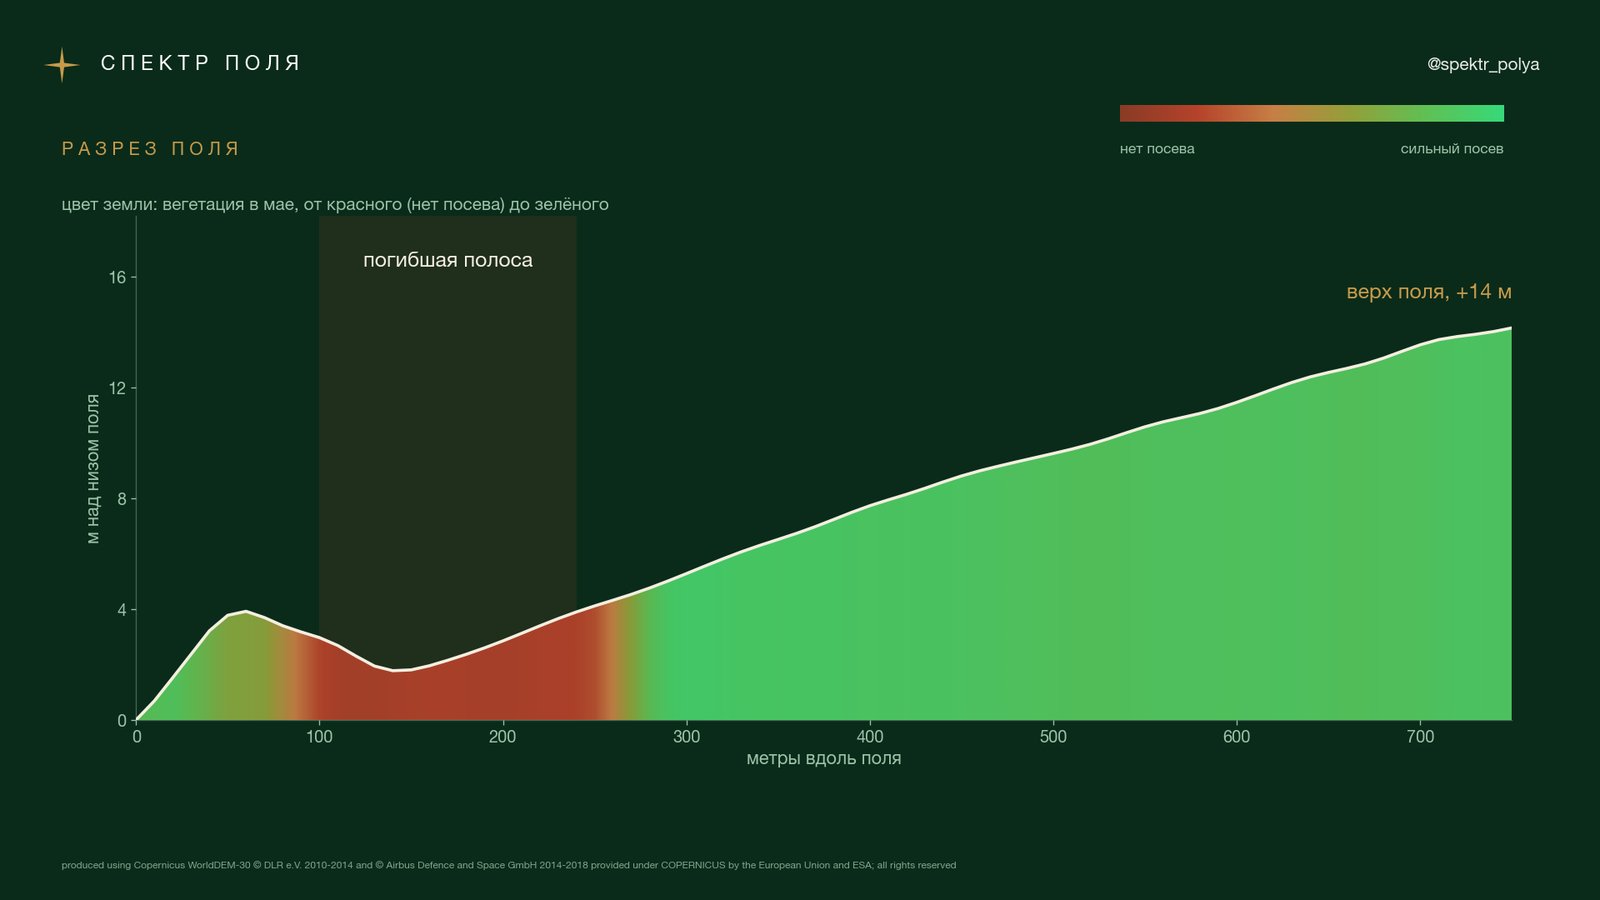
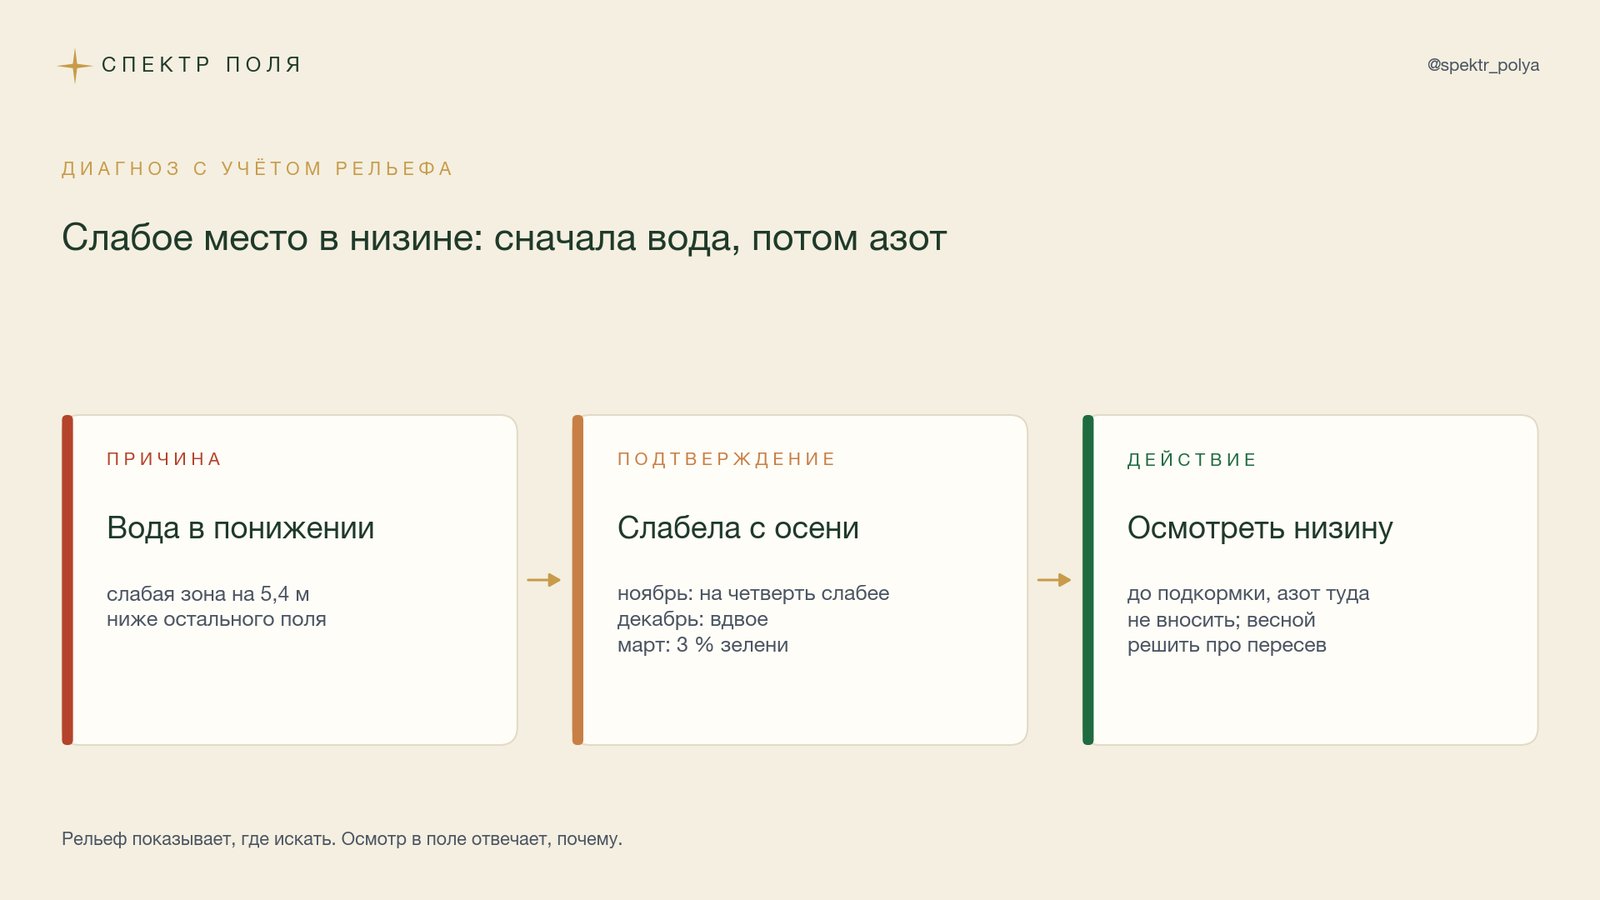
In spring, one of our pilot fields had no winter crop on a strip of a few hectares. We went back through the imagery from September. By late October the seedlings on the strip were already behind the rest of the field, by late November a quarter weaker (NDVI 0.64 against 0.84), by late December half as strong (0.40 against 0.84). The decline began before the January frosts. In mid-March only 3% of the strip was still green, while the rest of the field had recovered by April.
Relief showed where to look. The strip lies in a hollow, on average 5.4 m below the rest of the field, and that is where water from the field runs. The winter was wet: from December to March precipitation was 90-122% of normal, and January brought snow and three nights below -10 °C.
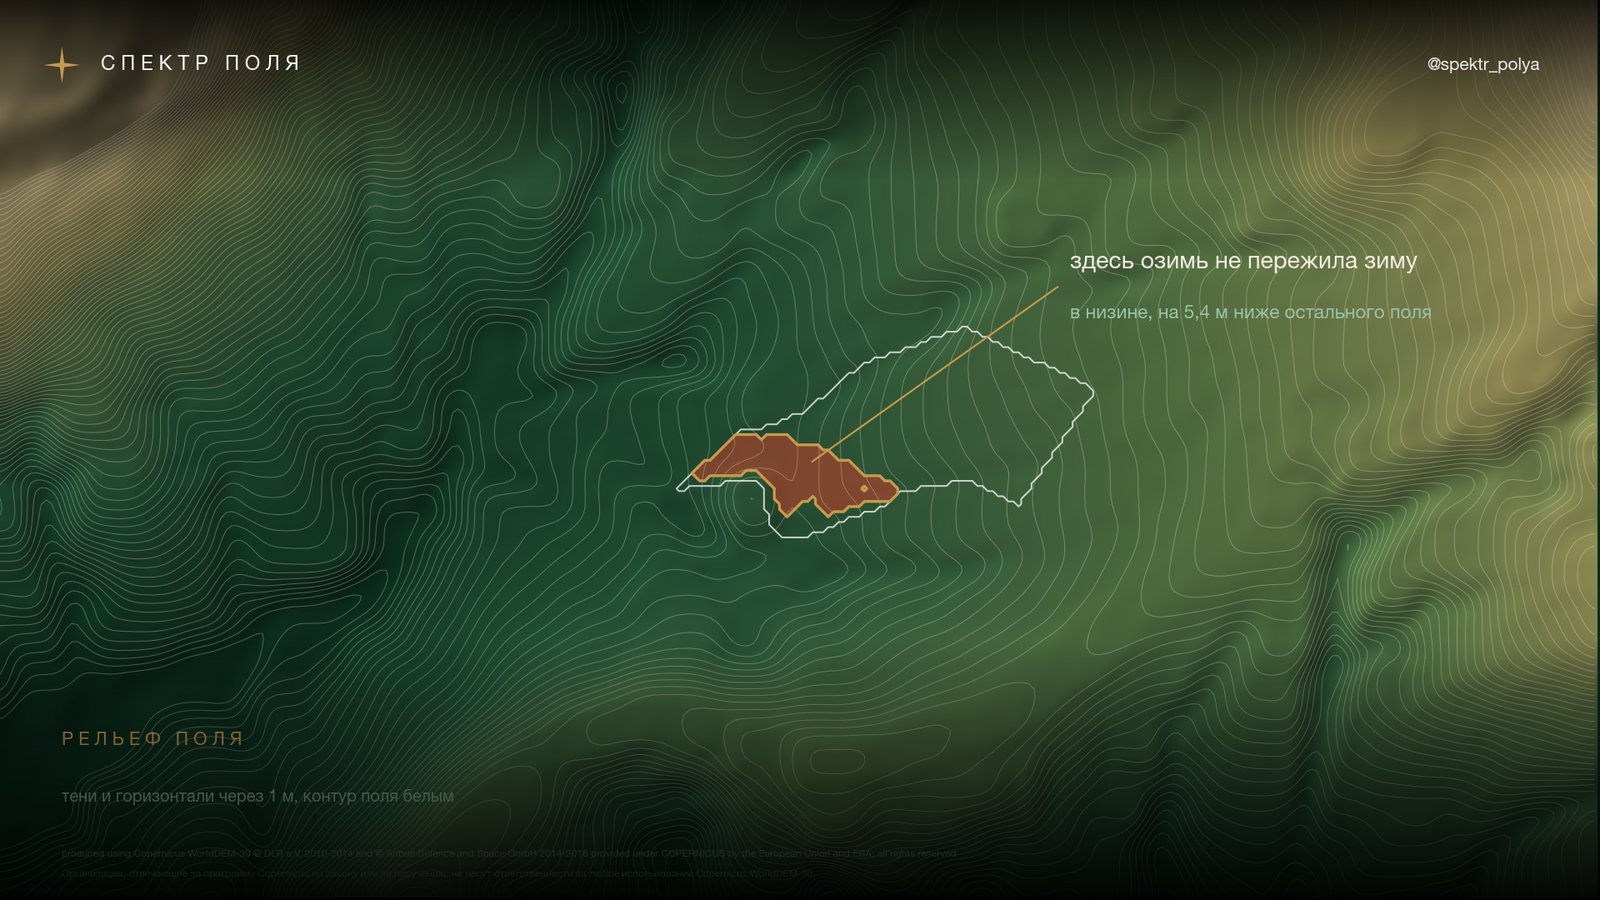
Why a satellite needs relief
A weak zone looks the same on a vegetation map whatever the cause. The red edge drops both under nitrogen starvation and when the crop has drowned. Reading the index alone, it is easy to put such a zone down to nitrogen deficiency and give it the highest rate in the task map. In a hollow that is a mistake: nitrogen will not help there, and part of it leaves with the water.
Relief answers the question of where water flows. It gathers in hollows, where crops suffer from waterlogging, smothering under snow or an ice crust. On rises and steep slopes water and soil move downhill, and weakness there more often comes from topsoil loss and dryness. The sign of the effect depends on the year: in a drought the hollows can be the best parts of a field, in a wet year the worst. So relief does not make the diagnosis on its own; it says which cause to check first.
What the terminal does now
For every field the terminal builds relief from the open Copernicus elevation model at 30 m:
- elevation with contour lines: where the field’s low and high ground are;
- slope by erosion class: under 1° flat, 1-3° gentle, 3-5° erosion possible, over 5° strong erosion;
- runoff: where water drains away, where it gathers, where runoff lines run;
- elevation profile along any line drawn on the map.
The main change is in the diagnosis. The terminal checks where each weak zone lies: in the lower or the upper part of the field’s height range, and how far below or above the rest of the field it sits on the same scene. If a weak zone is in low ground, it names water as the likely cause and proposes an inspection instead of a nitrogen task map. If it is on high ground, it names erosion and proposes soil sampling. When a weak zone is scattered across the field, relief does not explain it and the question stays one of nitrogen. On flat fields, with less than 3 m of relief, relief stays silent. Out of season the cause goes into next year’s plan and no action is proposed.
On this year’s April and May scenes the terminal reads the pilot strip exactly that way: water in low ground, the strip 5-6.5 m below the rest of the field. Before, that spot would have read as nitrogen deficiency.
Where the limits are
- 30 m sees dips and slopes metres deep. Furrows, drains and puddles a few centimetres deep are not visible. Those need a drone survey or RTK machine logs.
- The elevation model describes the surface. It includes shelterbelts and buildings. We remove narrow shelterbelts; large blocks of forest remain.
- On flat fields a field’s own relief can be smaller than the model’s accuracy. There the relief layer stays silent rather than inventing.
- Relief shows where to look, not why. On the pilot field we still do not know what killed the crop: waterlogging, smothering or an ice crust. A field inspection settles that, and radar after rain can show standing water.